Risk Monitor
The Insights 2.0 Risk Monitor dashboard provides a centralized hub for monitoring transactional behaviors that may indicate fraud, abuse, or operational risk across the business. Operators can use this dashboard suite to identify potentially suspicious activity, with a particular focus on employee-driven behaviors, investigate trends, and act quickly.
- Overview
- Employee
- Customer
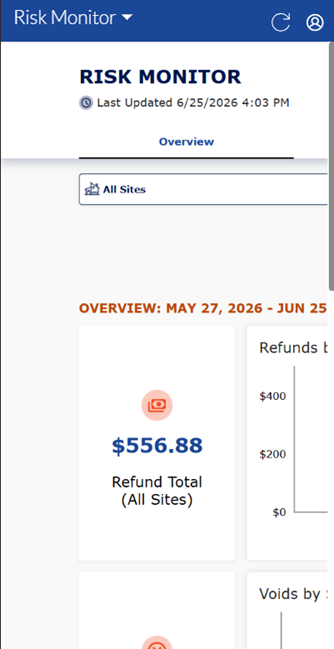
Insights 2.0 dashboards are accessible from within Patheon Portal, or directly from any mobile device or desktop computer at Insights.DRB.com.
Patheon Portal
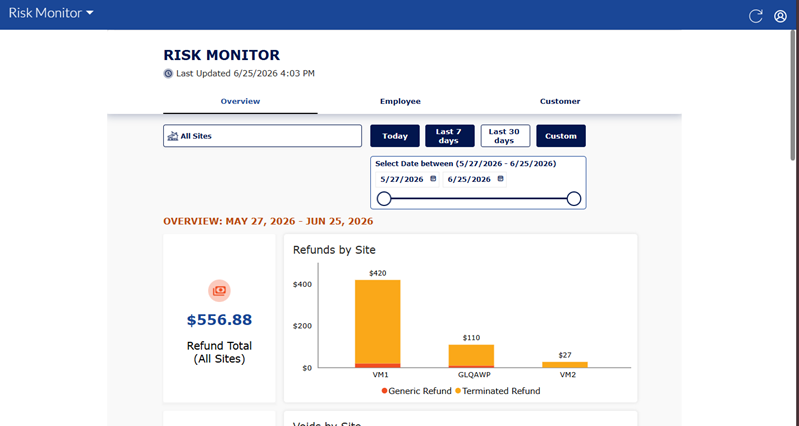
Mobile
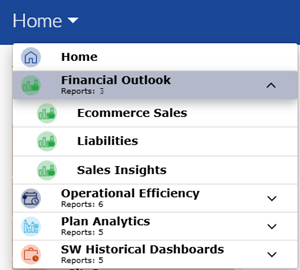
Dashboard Location
Insights 2.0>Financial Outlook>Risk Monitor
Dashboard Tools
The Risk Monitor dashboard includes the following functions: refresh, sign out, last updated time and date, and select a dashboard tool.
Refresh
Dashboards automatically refresh every 15 minutes. However, the dashboard header provides a refresh function to manually force a data refresh. When selected, it refreshes the data for all Insights 2.0 dashboards.
Note: Patheon Portal does not include the Refresh function. Use the web browser reload page function to manually refresh the data.
Sign Out
The user icon in the header provides a Sign Out function to sign out of Insights 2.0.
Last Updated
The date and time, based on the user's location, the dashboard data was last refreshed.
Important: Insights 2.0 dashboard data is near real-time. It reflects a 15-minute delay, so that the data can be processed and accurately rendered in the dashboards.
Overview
Insights 2.0>Financial Outlook>Risk Monitor>Overview
The Overview dashboard provides important risk activity statistics, as well as critical visibility into key operational trends across all sites. Organizations can use this to easily review total refunds, voids, and discounts, compare activity by site or location, and monitor a rolling 13-month view of trends to quickly identify spikes or patterns.
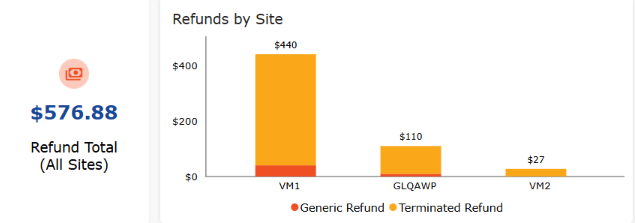
Refund Total (All Sites)
The Refund Total (All Sites) section provides the total refund dollars with a site-by-site breakdown and is split between Generic Refunds and Terminated Refunds.
Void Total (All Sites)
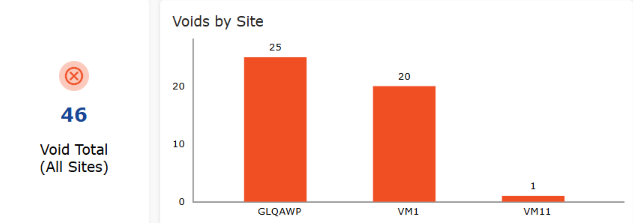
The Void Total (All Sites) section provides the count of voids across sites with a site-by-site breakdown.
Discount Total (All Sites)
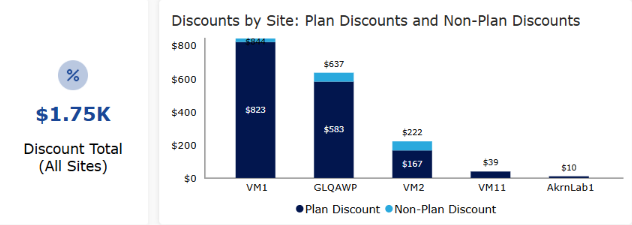
The Discount Total (All Sites) section provides the total amount of discounts with a site-by-site breakdown and is split between Plan Discount and Non-Plan Discount.
Rewash Total (All Sites)
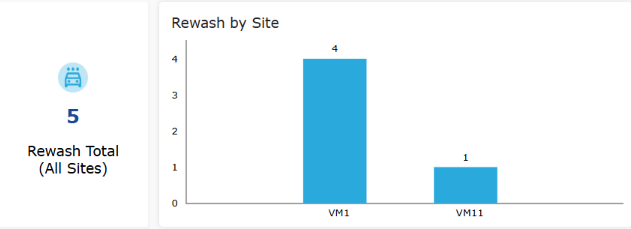
The Rewash Total (All Sites) section provides the total number of rewashes with a site-by-site breakdown.
Refunds, Voids, Rewashes, Discounts Count Over Time (Rolling 13 month)
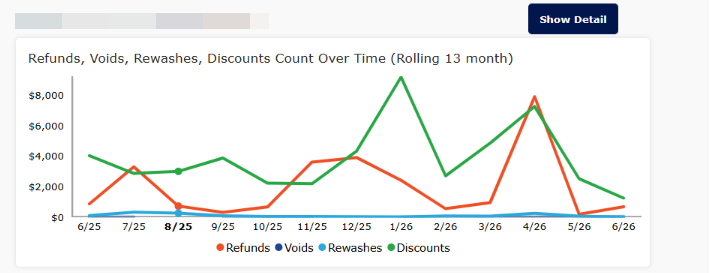
The Refunds, Voids, Rewashes, Discounts Count Over Time (Rolling 13 month) section provides a rolling 13-month trend view of refunds, voids, rewashes, and discounts, helping operators quickly identify spikes or patterns. A Show Detail button allows users to drill into site-specific data.
Employee
Insights 2.0>Financial Outlook>Risk Monitor>Employee
The Employee dashboard provides important employee-level risk activity statistics, as well as critical insight into which employees are driving the highest volumes of refunds and voids. Organizations can use this to easily identify top employees by refund dollars or void count, compare refund activity across employees, and monitor refund trends over time to help spot outliers that may warrant further review.
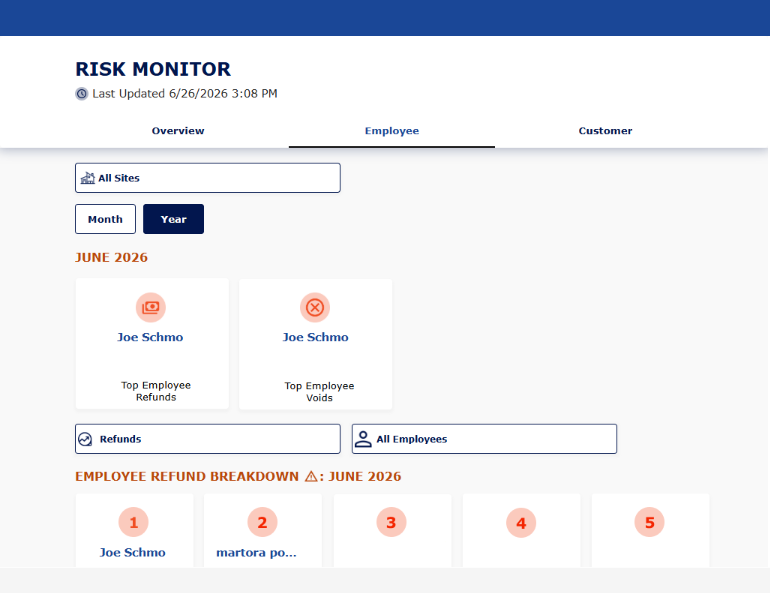
TIME PERIOD
By default, the data in the employee BREAKDOWN section is for the current month and year. The Time Period function provides the ability to select (and view) the data for a different month, or even a different year.
All Sites
Select All Sites to open a list of sites. Select a specific site to view its stats.
Month
Select Month to open a list of 1-month date ranges. The months are listed in Mon YYYY format, where Mon is the month's abbreviation and YYYY is the year.
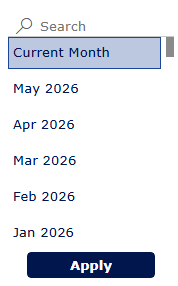
Select a specific month to view its stats for all sites.
Year
Select Year open a list of 1-year date ranges. The years are listed in YYYY format.
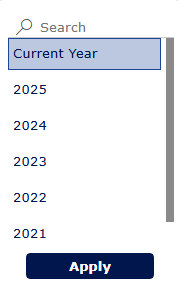
Select a specific year to view its stats for all sites.
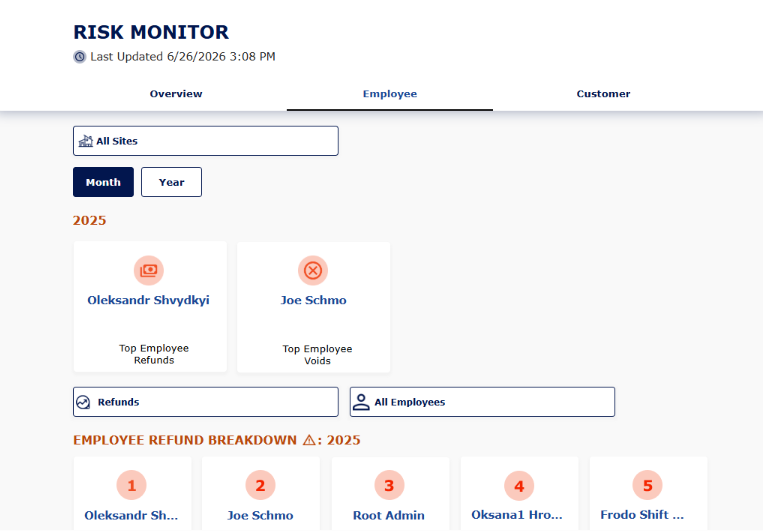
Top Employee Refunds
Displays the employee with the highest refund dollar total for the currently selected month or year.
Top Employee Voids
Displays the employee with the highest void count for the currently selected month or year.
Refunds
By default, the data in the employee breakdown section is for refunds. Select Refunds to open a list of transaction types.
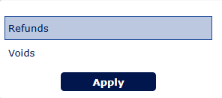
Select Refunds to display stats for refund transactions or Voids to display stats for voided transactions.
All employees
By default, the data in the employee breakdown section is for all employees. Select All Employees to select (and view) the data for a specific employee.
EMPLOYEE REFUND BREAKDOWN
The employee refund breakdown section provides a ranked top-5 view of employees by refund dollar amount.
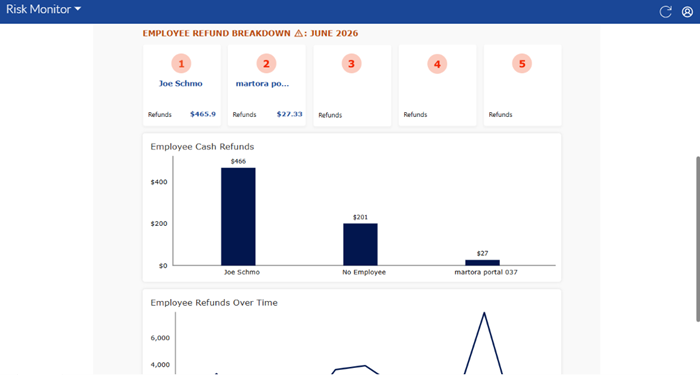
Employee Cash Refunds
Bar chart that displays the full employee list sorted by refund totals.
Employee Refunds Over Time
Line chart that displays the rolling 13-month trend of refund activity by employee.
EMPLOYEE VOIDS BREAKDOWN
The employee voids breakdown section provides a ranked top-5 view of employees by void count.
Employee Voids Count
Bar chart that displays the full employee list sorted by void counts.
Employee Voids Over Time
Line chart that displays the rolling 13-month trend of void activity by employee.
Customer
Insights 2.0>Financial Outlook>Risk Monitor>Customer
The Customer dashboard provides important customer-level activity statistics, as well as critical insight into which customers are driving the highest volumes of refunds and plan terminations. Organizations can use this to easily identify top customers by refund dollars or plans ended, compare refund activity across customers, and monitor customer behavior for patterns that may warrant further review.
By default, the data on the Customer dashboard is for all sites. Select All Sites to select (and view) data for a specific site.
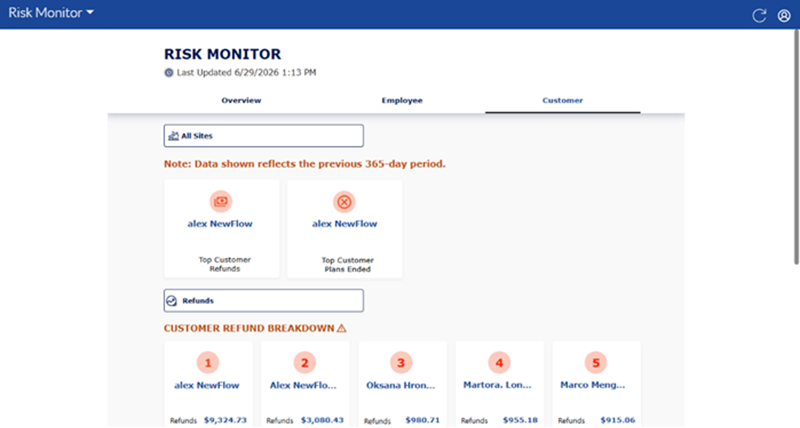
Top Customer Refunds
Displays the customer with the highest refund dollar total for the last year.
Top Customer Plans Ended
Displays the customer with the most plan terminations for the last year.
Refunds
By default, the data in the customer breakdown section is for refunds. Select Refunds to open a list of transaction types.
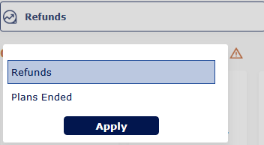
Select Refunds to display stats for refund transactions or Plans Ended to display stats for terminated plans.
CUSTOMER REFUND BREAKDOWN
The Customer Refund Breakdown section provides a ranked top-5 view of customers by refund dollar amount.
Customer Cash Refunds
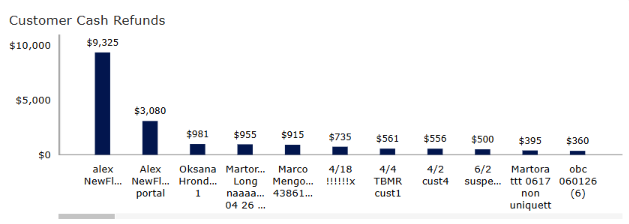
Bar chart that displays the full customer list sorted by refund totals.
CUSTOMER PLANS ENDED BREAKDOWN
The customer plans ended breakdown section provides a ranked top-5 view of customers by the number of plans ended and the number of plans ended before the first reload.
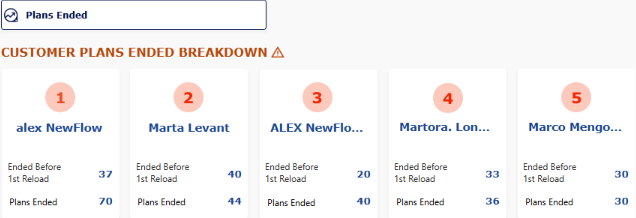
Ended Before 1st Reload
Displays the number of plans that were canceled before the first reloaded.
Plans Ended
Displays the number of plans ended.
Top Customer Plans Ended
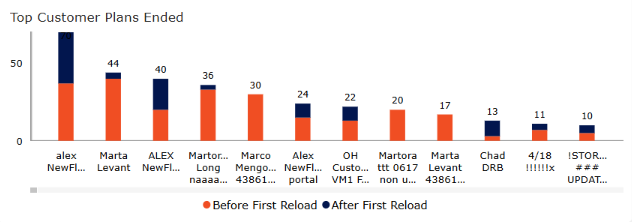
Bar chart that displays the customers with the highest number of ended plans, broken down by plans that ended before their first reload and after the first reload.