Sales Comparison
The Insights 2.0 Sales Comparison dashboard provides statistics for the following areas: sales by time period, daily statistics, sites, monthly stats, and running totals data. The Sales Comparison dashboard is comprised of five dashboards. Detailed information about each dashboard is provided below.
- Sales Comparison
- Daily Stats
- Site Comparison
- Monthly Stats
- Running Totals
Insights 2.0 dashboards are accessible from within Patheon Portal, or directly from any mobile device or desktop computer at Insights.DRB.com.
Patheon Portal
Mobile
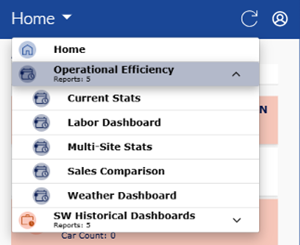
Dashboard Location
Insights 2.0>Operational Efficiency>Sales Comparison
Dashboard Tools
The Sales Comparison dashboard includes the following functions: refresh, sign out, select a site, and select a comparison time period.
Refresh
Dashboards automatically refresh every 15 minutes. However, the dashboard header provides a refresh function to manually force a data refresh. When selected, it refreshes the data for all Insights 2.0 dashboards.
Note: Patheon Portal does not include the Refresh function. Use the web browser reload page function to manually refresh the data.
Sign Out
The user icon in the header provides a Sign Out function to sign out of Insights 2.0.

Select a Dashboard
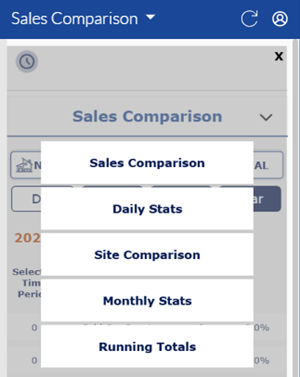
The Sales Comparison dashboard selector is located below the last updated information.
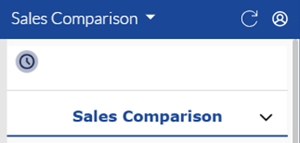
Selecting it opens the Sales Comparison dashboard menu. Use this to select one of the Sales Comparison dashboards.
Select a Site
The Sales Comparison dashboard site selector is located below the dashboard selector. Use this to select a specific site.
![]()
Selecting the current site opens a list with all sites. Users can navigate the list and select a specific site. The site list includes the following features: total cars, site search, and site 0 car count highlighting.
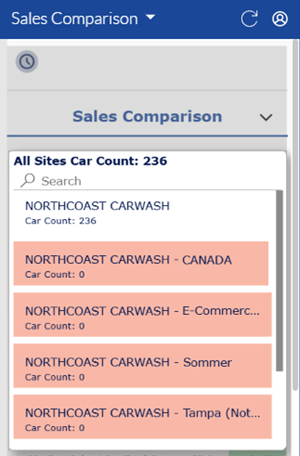
- All Sites Car Count: The top of the site list includes the sum of cars washed for all sites.
- Search: A search tool is available at the top of the site list for multi-site organizations that have a large number of sites. It can be used to quickly locate a site without navigating the entire list. Note: The search function is case-sensitive.
- Car Count: Each site in the list includes its car count for the current day.
- Car Count: 0: Sites with a car count of 0 have a red background to alert users that no cars have been washed at that site for the current day. Sites with a car count of 1 or more have a white background.
Sales Comparison
Insights 2.0>Operational Efficiency>Sales Comparison>Sales Comparison
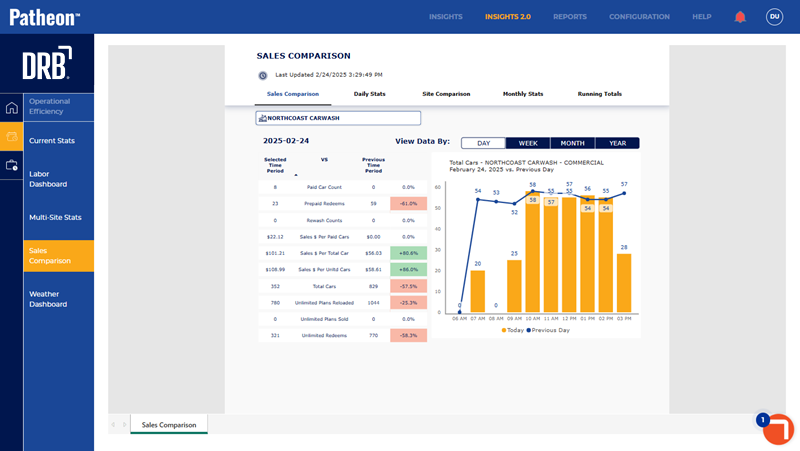
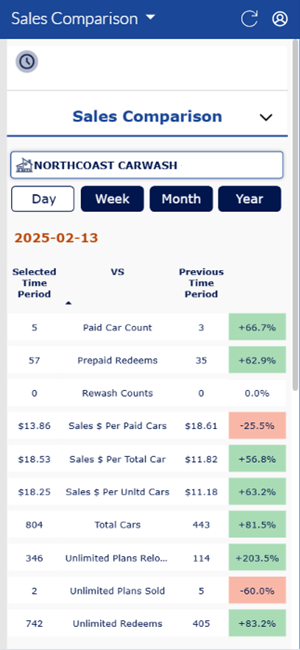
The Sales Comparison dashboard provides current vs. previous daily, weekly, monthly, and yearly time comparisons (e.g., current week vs previous week) for the following data points for a site: paid car count, redeemed prepaid count, rewash count, sales dollars per paid car, sales dollars per total car, total cars, unlimited plans reloaded count, unlimited plans sold count, and unlimited redeemed count.
Note: All comparisons are same-site only; the Sales Comparison dashboard doesn't provide the ability to compare site A vs. site B. Additionally, all time period comparisons are current time period vs. immediate previous time period only; the Sales Comparison dashboard doesn't provide the ability to select and specify two specific time periods, for example, week 42 vs. week 5.
Patheon Portal

Mobile

View Data By
The Sales comparison dashboard default time period is Day. Week, Month, and Year time period comparisons are also available.
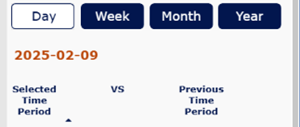
Day
Select Day to view a comparison of the current day's stats with the previous day's stats for the selected site.
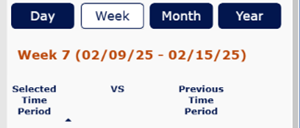
Week
Select Week to view a comparison of the current week's stats with the previous week's stats for the selected site.
Month
Select Month to view a comparison of the current month's stats with the previous month's stats for the selected site.
Year
Select Year to view a comparison of the current year's stats with the previous year's stats for the selected site.
Sales Comparison Table
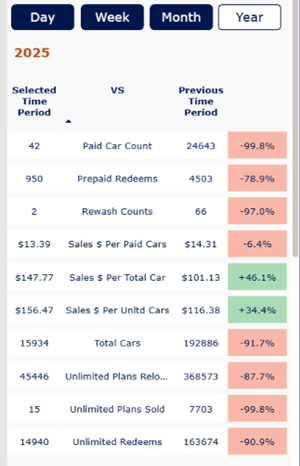
The Sales Comparison table provides stats for the current and previous selected time periods. It consists of four columns: current stat values (Selected Time Period), stat name, previous stat values (Previous Time Period), and increase/decrease percentage. If the current time period is higher than the previous time period, the percentage is a positive percentage (increase) with a green background. If the current time period is lower than the previous time period, the percentage is a negative percentage (decrease) with a red background.
Paid Car Count
The Paid Car Count metric provides the number of single paid washes purchased. It does not include unlimited plan washes, rewashes, or prepaid washes, for the selected time period.
Prepaid Redeems
The Prepaid Redeems metric provides the number of washes redeemed by unit wash plans (includes free wash codes), for the selected time period.
Rewash Counts
The Rewash Counts metric provides the number of $0.00 rewashes that were issued (from the Rewash tab at a cashier terminal or kiosk terminal), for the selected time period.
Sales $ Per Paid Cars
The Sales $ Per Paid Cars metric provides the average revenue per sale that contained a paid wash, for the selected time period.
Sales $ Per Total Car
The Sales $ Per Total Car metric provides the average revenue per sale that contained any wash, for the selected time period.
Sales $ Per Unltd Cars
The Sales & Per Unltd Cars metric provides the average revenue per sale that contained an unlimited wash plan wash, for the selected time period.
Total Cars
The Total Cars metric provides the number of all sales that included a wash, for the selected time period.
Unlimited Plans Reloaded
The Unlimited Plans Reloaded metric provides the number of unlimited wash plans successfully reloaded, for the selected time period.
Unlimited Plans Sold
The Unlimited Plans Sold metric provides the number of unlimited wash plan sold, for the selected time period.
Unlimited Redeems
The Unlimited Redeems metric provides the number of washes that were an unlimited wash plan redemption, for the selected time period.
Sales Comparison Graph
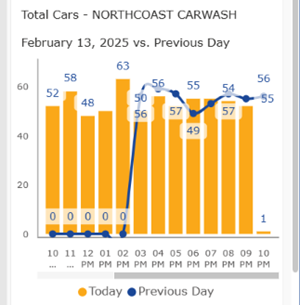
The sales comparison Total Cars graph provides the total car count for the current and previous selected time periods. The current time period car count is a yellow bar and the previous time period car count is a blue line.
Daily Stats
Insights 2.0>Operational Efficiency>Sales Comparison>Daily Stats
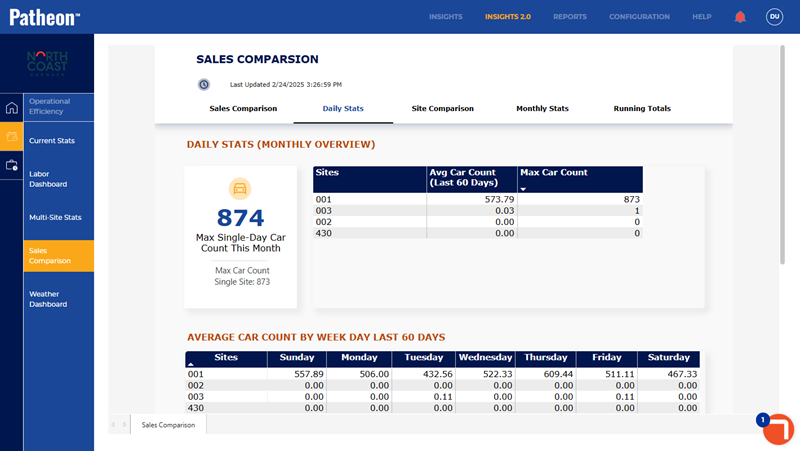
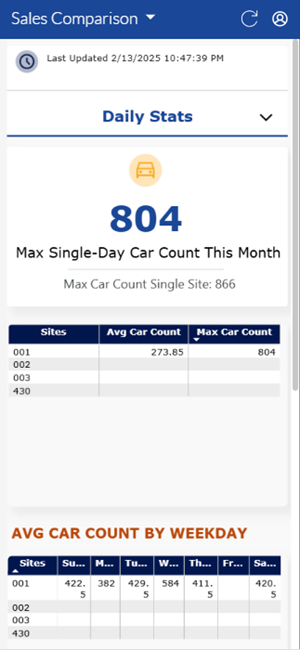
The Daily Stats dashboard provides the following data: the highest single-day car count for the current month (both sum of all sites and highest single site), average daily car count and highest daily car count for each site, and maximum car count for each weekday for each site.
Note: The site selector is not provided for the Daily Stats dashboard since it already provides data for each site.
Patheon Portal
Mobile
Max Single-Day Car Count This Month
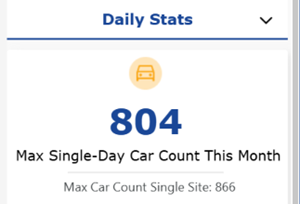
The Max Single-Day Car Count This Month statistic provides the highest sum of all sites, single-day car count for the current month.
Max Car Count Single Site
The Max Car Count Single Site statistic provides the highest single-site, single-day car count for the current month.
Avg Car Count + Max Car Count
The Avg Car Count and Max Car Count table provides the average daily car count and highest car count for the current month, for each site.

Sites
The Sites column provides the name of each site within the organization.
The column can be sorted in ascending or descending alphanumerical order by selecting its header.
Avg Car Count
The Avg Car Count column provides the average daily car count for the current month for the corresponding site.
The column can be sorted in ascending or descending numerical order by selecting its header.
Max Car Count
The Max Car Count column provides the highest daily car count for the current month for the corresponding site.
The column can be sorted in ascending or descending numerical order by selecting its header.
AVG CAR COUNT BY WEEKDAY
The Avg Car Count by Weekday section provides a table with the following data for each site in an organization: average daily car count for each weekday, for the current month.
Each column can be sorted in ascending or descending order by selecting its header.
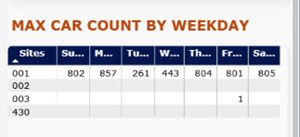
MAX CAR COUNT BY WEEKDAY
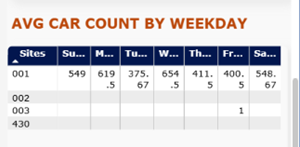
The Max Car Count by Weekday section provides a table with the following data for each site in an organization: the highest daily car count for each weekday, for the current month. For example, if site A has the following car counts for the first three Mondays in the current month, 723, 1,078, and 345, then Monday for that site.will report 1,078.
Each column can be sorted in ascending or descending order by selecting its header.
Site Comparison
Insights 2.0>Operational Efficiency>Sales Comparison>Site Comparison
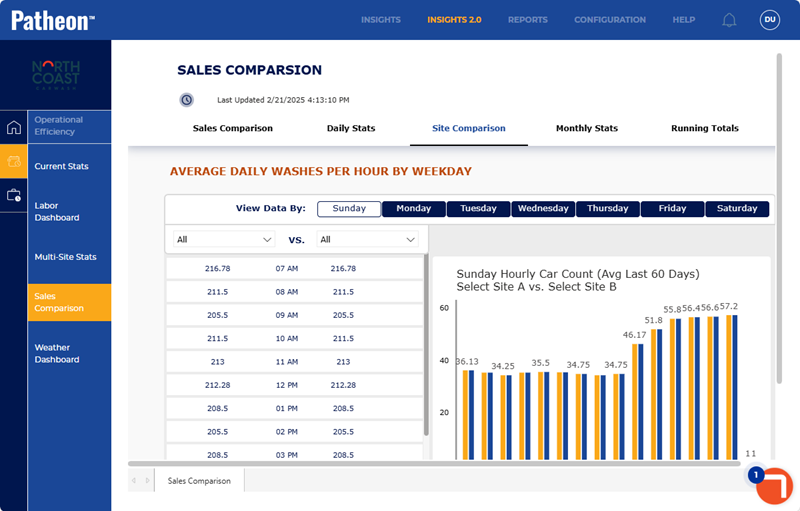
The Site Comparison dashboard provides organizations the ability to compare one site to another site, or one site to all sites, for the following statistic: average daily washes per hour by weekday, for the past 60 days. It includes an Average Daily Washes per Hour by Weekday section, which consists of a day selector, two site selectors, a data table, and a data graph.
Patheon Portal
Mobile
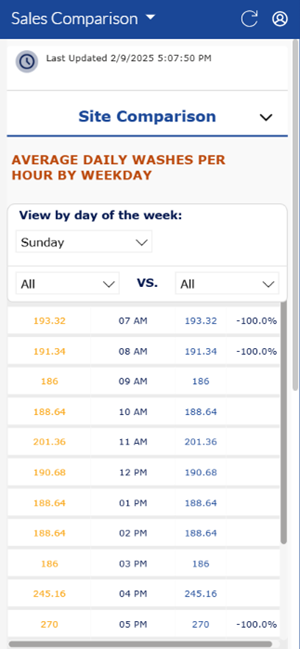
AVERAGE DAILY WASHES PER HOUR BY WEEKDAY
The Average Daily Washes per Hour by Weekday section consists of a day selector, two site selectors, a data table, and a data graph.
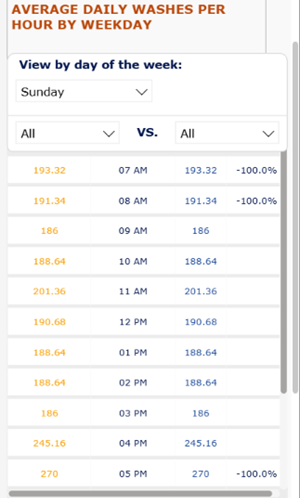
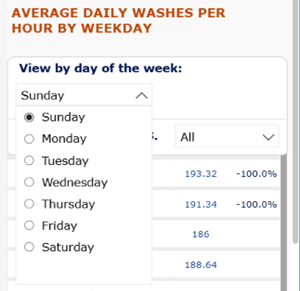
View by day of the week
The View by day of the week weekday selector provides users the ability to select a weekday to view.
Site Selectors
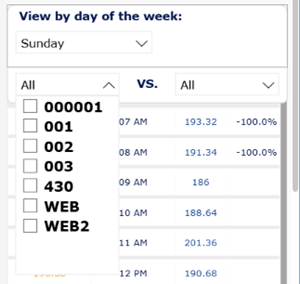
The site selectors provide the ability to select two sites to compare average daily washes per hour. Users can also compare one site to all sites.
Note: Sites can't be multi-selected for a column; selecting one site and then selecting another site will deselect the first site. To set a column to All, select a selected site to deselect it; the column sets to All.
Weekday Hourly Car Count Table
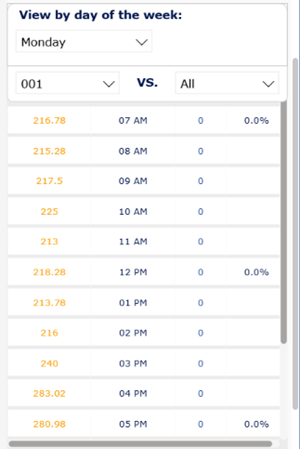
The average daily washes per hour provides the average number of washes each hour during day (based on the last 60 days), for the two selected sites. If the first site is higher than the second site, the percentage is a positive percentage (increase) with a green background. If the first site is lower than the second site, the percentage is a negative percentage (decrease) with a red background.
Weekday Hourly Car Count Graph
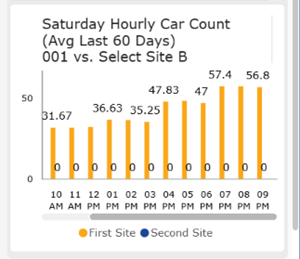
The average daily washes per hour provides the average number of washes each hour during day (based on the last 60 days), for the two selected sites. The first site is represented on the graph with yellow bars and the second site is represented on the graph with blue bars.
Monthly Stats
Insights 2.0>Operational Efficiency>Sales Comparison>Monthly Stats
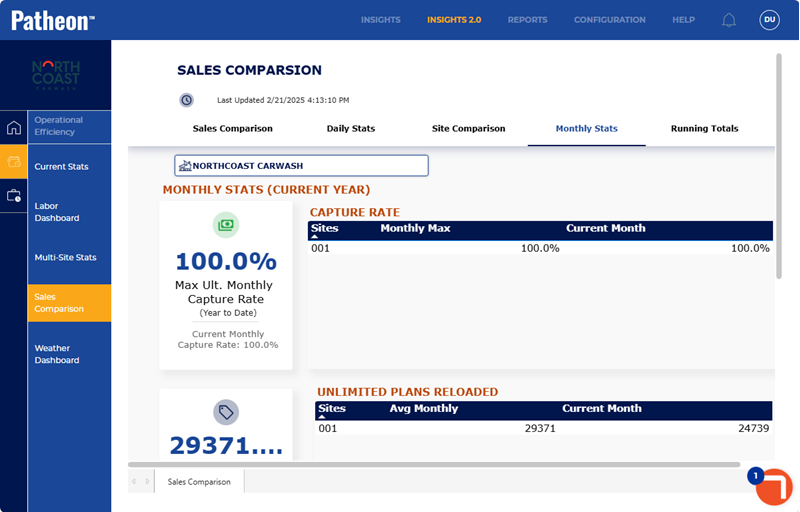
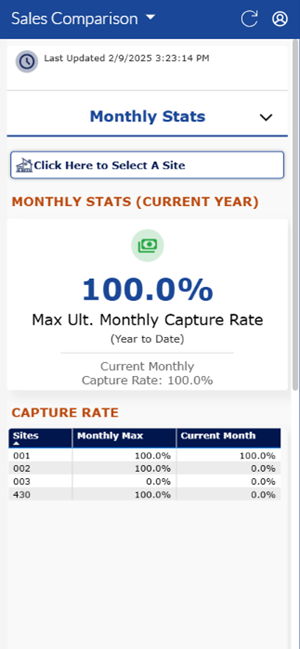
The Monthly Stats dashboard provides the following data points for a site: monthly capture rates, multi-site capture rate comparison, unlimited wash plan reload rates, multi-site unlimited plan reload comparison, current month plan reloads, and current month plan reload comparison.
Patheon Portal
Mobile
MONTHLY STATS (CURRENT YEAR)
The Monthly Stats (Current Year) section provides monthly capture rate data for the selected site.
Max Ult. Monthly Capture Rate (Year to Date)
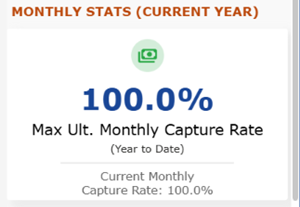
The Max Ult. Monthly Capture Rate metric is the highest monthly percent of potential non-plan customers that were converted to plan memberships, for the current year, for the selected site.
Current Monthly Capture Rate
The Current Monthly Capture Rate metric is the percent of potential non-plan customers that were converted to plan member for the current month, for the selected site.
CAPTURE RATE
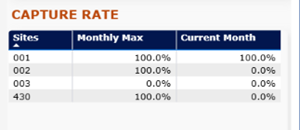
The Capture Rate section provides the highest monthly capture rate and current monthly capture rate for each site in an organization.
Sites
The Sites column provides the name of each site within the organization.
The column can be sorted in ascending or descending alphanumerical order by selecting its header.
Monthly Max
The highest monthly percent of potential non-plan customers that were converted to plan memberships, for each site in an organization.
The column can be sorted in ascending or descending numerical order by selecting its header.
Current Month
The percent of potential non-plan customers that were converted to plan member for the current month, for each site in an organization.
The column can be sorted in ascending or descending numerical order by selecting its header.
Average Unlimited Plans Reloaded Monthly
The average number of unlimited wash plans that were successfully reloaded each month for the current year, for the selected site.
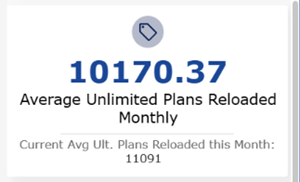
Current Avg Ult. Plans Reloaded this Month
The average number of unlimited wash plans that were successfully reloaded for the current month, for the selected site.
UNLIMITED PLANS RELOADED
The Unlimited Plans Reloaded section provides unlimited wash plan reload data for all sites in an organization.
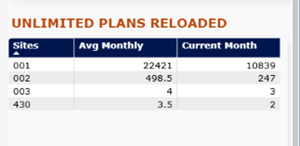
Sites
The Sites column provides the name of each site within the organization.
The column can be sorted in ascending or descending alphanumerical order by selecting its header.
Avg Monthly
The Avg Monthly column provides the average number of unlimited wash plans that were successfully reloaded for the current month, for the selected site.
The column can be sorted in ascending or descending numerical order by selecting its header.
Current Month
The Current Month column provides the number of unlimited wash plans that were successfully reloaded for the current month, for the selected site.
The column can be sorted in ascending or descending numerical order by selecting its header.
Plans Reloaded This Month
The Plans Reloaded This Month graph provides data for manually reloaded wash plans and plans that weren't lost to churn for the current month in a graph.
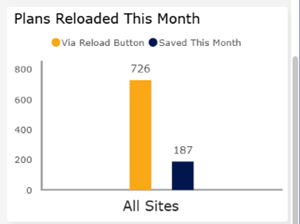
Via Reload Button
The number of wash plans that were manually reloaded from the kiosk terminal this month, for the selected site. This data is presented as a yellow bar.
Saved This Month
The number of wash plans that were successfully reloaded before they churned out this month, for the selected site. This data is presented as a blue bar.
PLAN RELOADS THIS MONTH
The Plan Reloads This Month section provides data for manually reloaded wash plans and plans that weren't lost to churn for the current month in a table.

Sites
The Sites column provides the name of each site within the organization.
The column can be sorted in ascending or descending alphanumerical order by selecting its header.
Via Reload Button
The Via Reload Button column provides the number of wash plans that were manually reloaded from a kiosk terminal this month, for the selected site.
The column can be sorted in ascending or descending numerical order by selecting its header.
Saved This Month
The Saved This Month column provides the number of wash plans that were successfully reloaded before they churned out this month, for the selected site.
The column can be sorted in ascending or descending numerical order by selecting its header.
Running Totals
Insights 2.0>Operational Efficiency>Sales Comparison>Running Totals
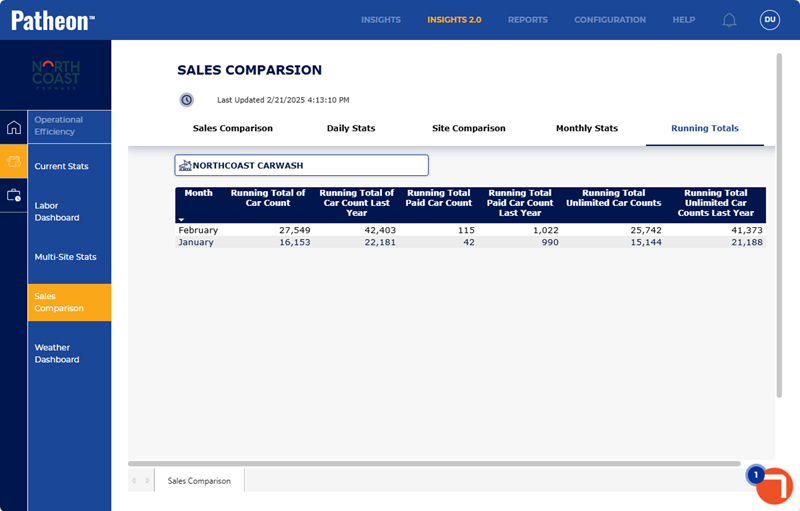
The Running Totals dashboard provides a current year-to-previous year, month-by-month, comparison (e.g., January 2024 vs. January 2025, February 2024 vs. February 2025) for the following data points for a specific site: total car count, total paid car count, and unlimited car count.
Patheon Portal
Mobile
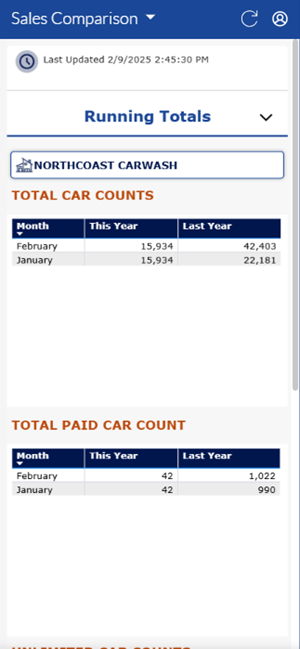
TOTAL CAR COUNTS
The Total Car Counts section provides a table that compares the total car count each month for the current year to the corresponding month for the previous year. The total car count includes any transaction that contained a wash; it includes single paid washes, wash plan redemptions, rewashes, prepaid code wash redemptions.
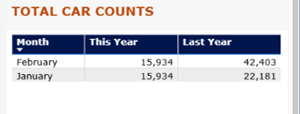
Month
The Month column provides the months for the current year.
The column can be sorted in ascending or descending alphanumerical order by selecting its header.
This Year
The This Year column provides the number of cars washed for the corresponding month for the current year.
The column can be sorted in ascending or descending numerical order by selecting its header.
Last Year
The Last Year column provides the number of cars washed for the corresponding month for the previous year.
The column can be sorted in ascending or descending numerical order by selecting its header.
TOTAL PAID CAR COUNT
The Total Paid Car Count section provides a table that compares the total paid car count each month for the current year to the corresponding month for the previous year. The total paid car count includes any transaction that contained a wash that was not a wash plan redemption, a rewash, or a prepaid code wash redemption.
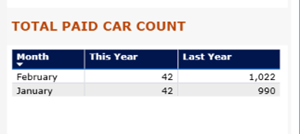
Month
The Month column provides the months for the current year.
The column can be sorted in ascending or descending alphanumerical order by selecting its header.
This Year
The This Year column provides the number of cars washed by a paid wash for the corresponding month for the current year.
The column can be sorted in ascending or descending numerical order by selecting its header.
Last Year
The Last Year column provides the number of cars washed by a paid wash for the corresponding month for the previous year.
The column can be sorted in ascending or descending numerical order by selecting its header.
UNLIMITED CAR COUNTS
The Unlimited Car Counts section provides a table that compares the total unlimited wash plan count each month for the current year to the corresponding month for the previous year. The total unlimited car count includes any transaction that contained a wash that was a wash plan redemption.
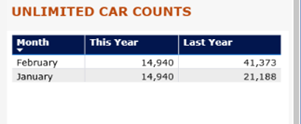
Month
The Month column provides the months for the current year.
The column can be sorted in ascending or descending alphanumerical order by selecting its header.
This Year
The This Year column provides the number of cars washed as part of an unlimited wash plan for the corresponding month for the current year.
The column can be sorted in ascending or descending numerical order by selecting its header.
Last Year
The Last Year column provides the number of cars washed as part of an unlimited wash plan for the corresponding month for the previous year.
The column can be sorted in ascending or descending numerical order by selecting its header.