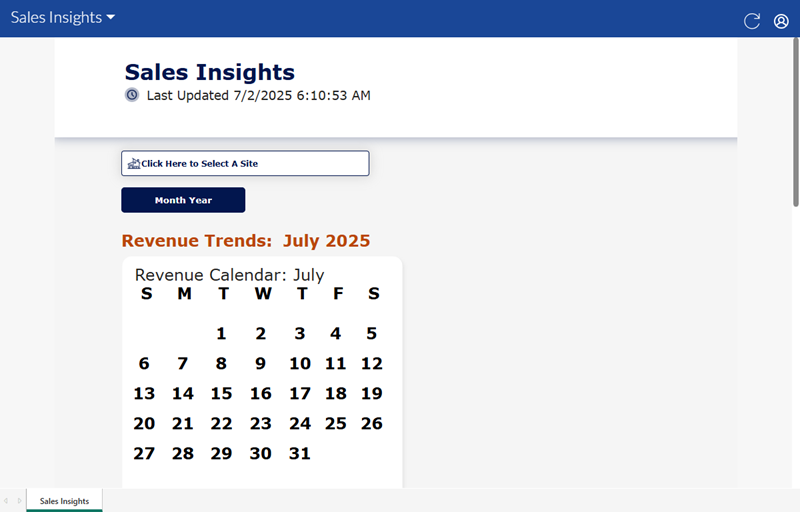
Sales Insights
The Insights 2.0 Sales Insights dashboard provides visibility into revenue trends, wash performance, and sales metrics. This dashboard supports performance tracking and helps surface patterns across time and product types. Organizations can use it to easily view daily revenue in a calendar layout to spot high- and low-performing days, track revenue trends over time with intuitive time series charts, compare revenue per car to understand operational efficiency, and review monthly plan and wash metrics, including sales revenue, discounts, sales count, and net revenue. Detailed information about each dashboard is provided below.
- Insights Overview
- Insights Details
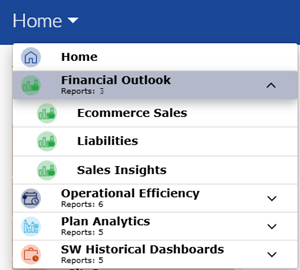
Insights 2.0 dashboards are accessible from within Patheon Portal, or directly from any mobile device or desktop computer at Insights.DRB.com.
Dashboard Location
Insights 2.0>Financial Outlook>Sales Insights
Dashboard Tools
The Sales Insights dashboard provides the following functions and information: refresh, sign out, and last updated time and date.
Refresh
Dashboards automatically refresh every 15 minutes. However, the dashboard header provides a refresh function to manually force a data refresh. When selected, it refreshes the data for all Insights 2.0 dashboards.

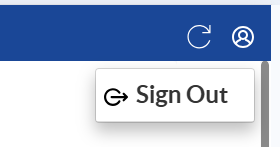
Sign Out
The user icon in the header provides a Sign Out function to sign out of Insights 2.0.
Last Updated
The date and time, based on the user's location, the dashboard data was last refreshed.

Important: Insights 2.0 dashboard data is near real-time. It reflects a 15-minute delay, so that the data can be processed and accurately rendered in the dashboards.
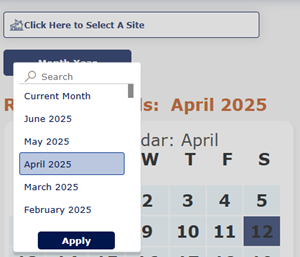
Site
The Site function provides the ability to select a specific site, multiple select-sites, or all sites for the dashboard data.

Month Year
The Month Year function provides the ability to select a specific month and year for the dashboard data.
Revenue Trends
The Revenue Trends section provides a calendar, revenue graph, and revenue per car graph.
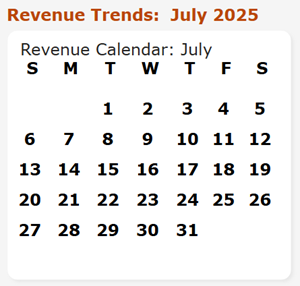
Revenue Calendar
The Revenue Calendar displays the selected calendar month.
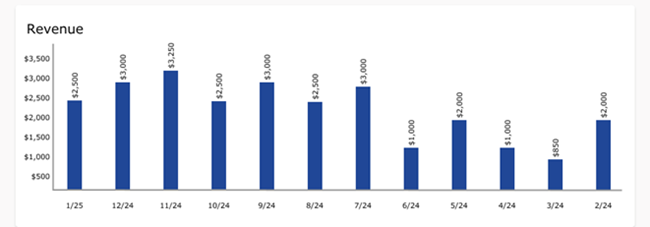
Revenue
The Revenue graph provides the total revenue recorded each month, for the selected month and the months prior to it.
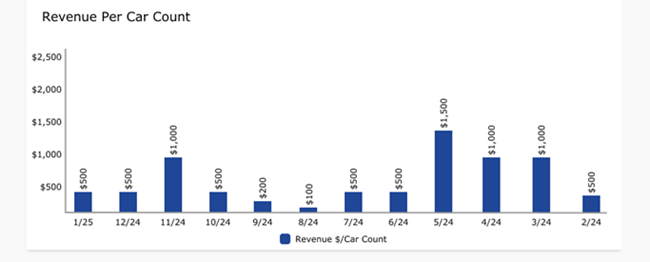
Revenue Per Car Count
The Revenue Per Car Count graph provides the average revenue recorded per car (sale) for the selected month and the months prior to it.
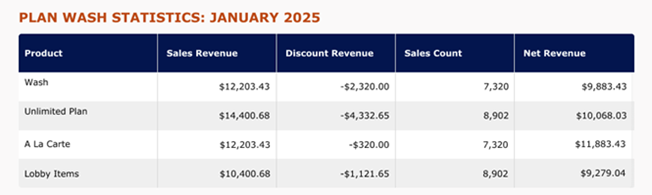
PLAN WASH STATISTICS
The Plan Wash Statistics section provides a table that provides sales revenue, discount revenue, sales count, and net revenue.
Product
The Product column provides the name of each product type.
The column can be sorted in ascending or descending alphanumerical order by selecting its header.
Sales Revenue
The Sales Revenue column provides the total amount recorded, before discounts, for the corresponding product type, for the selected time period.
The column can be sorted in ascending or descending numerical order by selecting its header.
Discount Revenue
The Discount Revenue column provides the total discount amount recorded for the corresponding product type, for the selected time period.
The column can be sorted in ascending or descending numerical order by selecting its header.
Sales Count
The Sales Count column provides the number of sales that included the corresponding product type, for the selected time period.
The column can be sorted in ascending or descending numerical order by selecting its header.
Net Revenue
The Net Revenue column provides the difference, in amount, between the corresponding Sales Revenue and Discount Revenue, for the selected time period.
The column can be sorted in ascending or descending numerical order by selecting its header.
Insights Details
Insights 2.0>Financial Outlook>Sales Insights>Insights Details
The Insights Details dashboard provides key metrics such as: counts and types of washes (filterable by wash type, location, month, year, or employee), all discounts applied (by type and amount), gross and net revenue (with period and location/employee breakdowns), total plans sold, and plans reloaded. Use it to monitor service mix, understand discount impact on revenue, and track plan sales and reload activity to evaluate performance individual contribution over time.
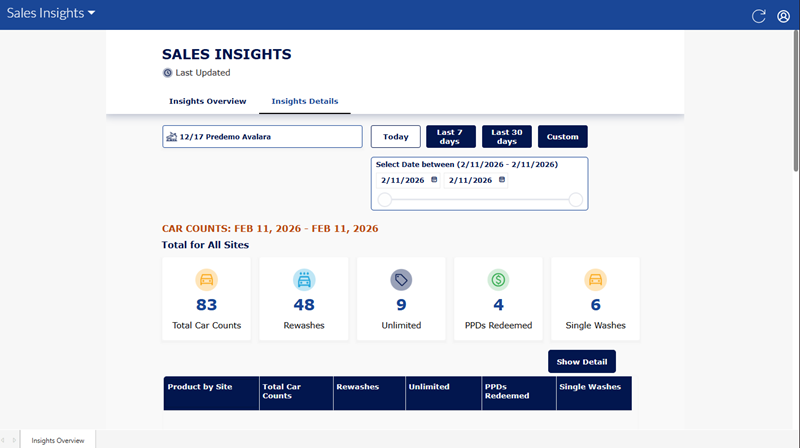
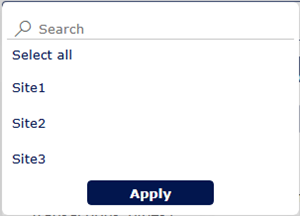
Site
The Insights Details site selector provides the ability to select a single site, multiple select-sites, or all sites.
Selecting the site selector opens a list with all sites. Users can navigate down the list and select a single site, multi-select specific sites, or all sites.
Time Period
The Time Period function provides the ability to select (and view) the data for a different day or time period: Today (the current day is selected by default), Last 7 days, Last 30 days, or Custom.
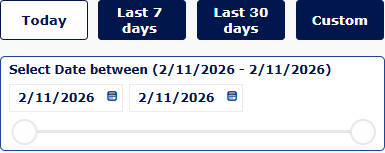
Today
Select Today to open the calendar pop-up and choose the current date; the selected date will be shown in MM-DD-YYYY format, where MM is the month, DD is the day, and YYYY is the year.
Last 7 days
Select Last 7 days to open the calendar pop-up with the most recent seven-day range (you can adjust the start and end); the selected dates will be shown in MM-DD-YYYY format.
Last 30 days
Select Last 30 days to open the calendar pop-up with the most recent thirty-day range (you can adjust the start and end); the selected dates will be shown in MM-DD-YYYY format.
Custom
Select Custom to open the calendar pop-up and pick any start and end dates; the chosen dates will be shown in MM-DD-YYYY format.
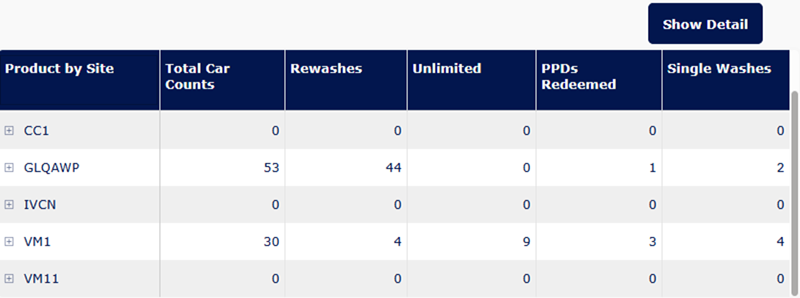
CAR COUNTS
The car counts section provides metrics for total car counts (count), rewashes (count), unlimited washes (count), PPDs redeemed (count), and single washes (count).
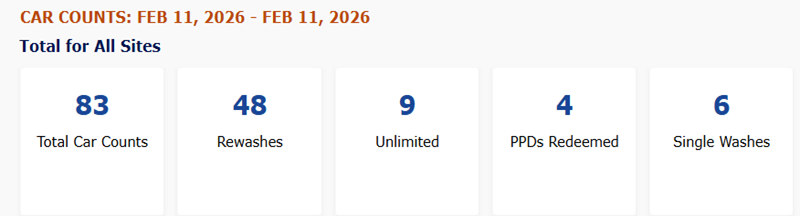
Total Car Counts
The Total Car Counts metric provides the total number of cars washed for the selected site(s) and time period.
Rewashes
The Rewashes metric provides the total number of rewashes for the selected site(s) and time period.
Unlimited
The Unlimited metric provides the total number of cars washed associated to unlimited plans for the selected site(s) and time period.
PPDs Redeemed
The PPDs Redeemed metric provides the total number of cars washed associated to prepaids for the selected site(s) and time period.
Single Washes
The Single Washes metric provides the total number of cars washed not associated to plans or prepaids for the selected site(s) and time period.
Show Detail
The Show Detail section provides a table of product by site, total car counts, rewashes, unlimited plan uses, PPDs redeemed, and single washes by site.
REVENUE
The revenue section provides metrics for transaction count, gross revenue, discounts, and net revenue, allowing assessment of sales volume and revenue after discounts.
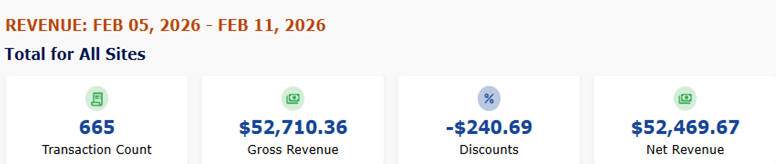
Transaction Count
The Transaction Count metric provides the total number of transactions for the selected site(s) and time period.
Gross Revenue
The Gross Revenue metric provides the total revenue, in dollars, for the selected site(s) and time period.
Discounts
The Discounts metric provides the total amount of discounts, in dollars, for the selected site(s) and time period.
Net Revenue
The Net Revenue metric provides the total amount of net revenue, in dollars, for the selected site(s) and time period.
Show Detail
The Show Detail section provides a table of product type by site, transaction count, gross revenue, discounts, and net revenue.
PLANS SOLD
The plans sold section provides metrics for sold count, revenue from new plans sold, revenue from reloads, and reload counts, allowing evaluation of plan sales performance and reload contribution to overall revenue.
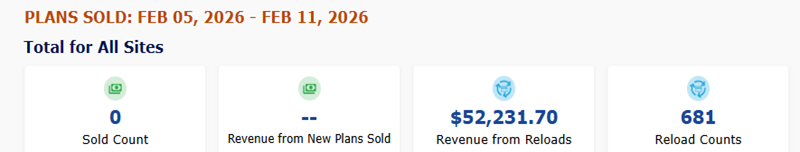
Sold Count
The Sold Count metric provides the count of plans sold for the selected site(s) and time period.
Revenue from New Plans Sold
The Revenue from New Plans Sold metric provides the total revenue, in dollars, from new plans sold for the selected site(s) and time period.
Revenue from Reloads
The Revenue from Reloads metric provides the total revenue, in dollars, from plan reloads for the selected site(s) and time period.
Reload Counts
The Reload Counts metric provides number of reloads for the selected site(s) and time period.
Show Detail
The Show Detail section provides a table of plan type by site, sold count, revenue from new plans sold, revenue from reloads, and reload counts.