Sales Leaderboard
The Insights 2.0 Sales Leaderboard dashboard provides an interactive, performance-driven view into employee sales activity. The dashboard helps operators visualize rankings, trends, and retention patterns across plans and sites, empowering leaders to identify top performers and opportunities for coaching. The employee summary table is also exportable and can be used for manual commission calculations. Detailed information about each dashboard is provided below.
- Leaderboard
- Plan Overview
- Site Overview
- Employee Summary
- Plan Retention
Insights 2.0 dashboards are accessible from within Patheon Portal, or directly from any mobile device or desktop computer at Insights.DRB.com.
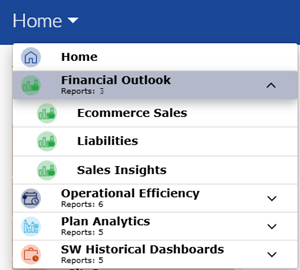
Dashboard Location
Insights 2.0>Financial Outlook>Sales Leaderboard
Dashboard Tools
The Sales Leaderboard dashboard provides the following functions and information: refresh, sign out, and last updated time and date.
Refresh
Dashboards automatically refresh every 15 minutes. However, the dashboard header provides a refresh function to manually force a data refresh. When selected, it refreshes the data for all Insights 2.0 dashboards.

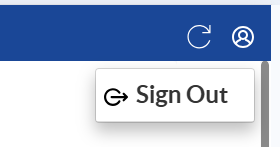
Sign Out
The user icon in the header provides a Sign Out function to sign out of Insights 2.0.
Last Updated
The date and time, based on the user's location, the dashboard data was last refreshed.

Important: Insights 2.0 dashboard data is near real-time. It reflects a 15-minute delay, so that the data can be processed and accurately rendered in the dashboards.
Leaderboard
Insights 2.0>Financial Outlook>Sales Leaderboard>Leaderboard
The Leaderboard dashboard provides employee rankings by total sales (1st–10th place and beyond).
Includes visibility into sales dollars, and plan sales/ends specifically, enabling quick comparison between total vs. membership performance. View top performers by location or organization to celebrate high achievers and motivate the team.
All Sites
Use the site selector to view the Leaderboard dashboard data (Total Sales, Plans Sold, and Plans Ended) for all sites in an organization, multiple select sites in an organization, or a single specific site.
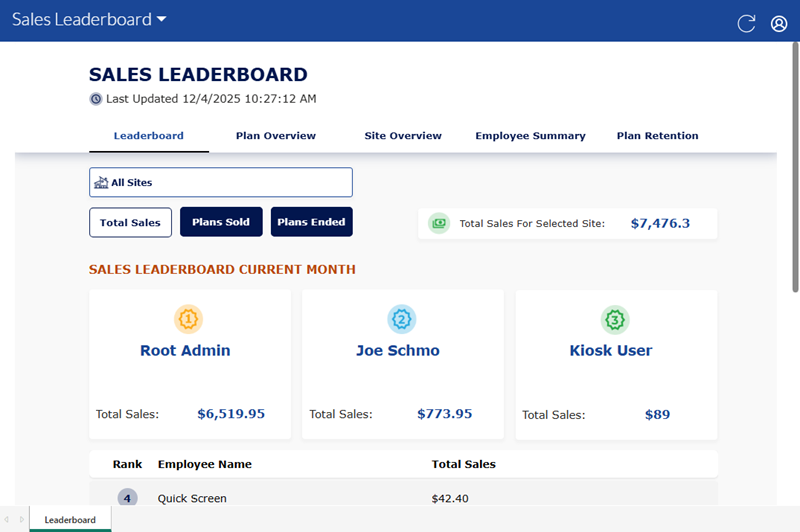
Total Sales
Total Sales is selected by default when the Leaderboard dashboard opens. It provides the sum of sales recorded for the selected site, total, and for each employee.
Total Sales For Selected Site
The total dollar amount in sales for the selected site, for the current month. It is the sum of all the individual employee sale amounts in the Sales Leaderboard Current Month section.
SALES LEADERBOARD CURRENT MONTH
The Sales Leaderboard Current Month section provides individual employee sales metrics for total sales. The top three employees, by sales amount, are ranked 1, 2, and 3, and highlighted with dedicated blocks. The rest of the employees, ranked 4 and lower, are listed in a table with their Rank (top to bottom, highest to lowest), Employee Name, and Total Sales.
Plans Sold
Select Plans Sold to view the sum of plan sales recorded for the selected site(s) for the current month, as well as for each employee.
Plans Sold
The total dollar amount in plan sales for the selected site, for the current month. It is the sum of all the individual employee plan sale amounts in the Unlimited Plans Sold Leaderboard Current Month section.
UNLIMITED PLANS SOLD LEADERBOARD CURRENT MONTH
The Unlimited Plans Sold Leaderboard Current Month section provides individual employee sales metrics for plan sales. The top three employees, by plan sales amount, are ranked 1, 2, and 3, and highlighted with dedicated blocks. The rest of the employees, ranked 4 and lower, are listed in a table with their Rank (top to bottom, highest to lowest), Employee Name, and Plans Sold.
Plans Ended
Select Plans Ended to view the sum of plans ended for the selected site(s) for the current month, as well as for each employee.
Plans Ended
The total count of plans ended for the selected site, for the current month. It is the sum of all the individual employee ended plan counts in the Unlimited Plans Ended Leaderboard Current Month section.
UNLIMITED PLANS ENDED LEADERBOARD CURRENT MONTH
The Unlimited Plans ENDED Leaderboard Current Month section provides individual employee metrics for ended plan counts. The top three employees, by ended plan counts, are ranked 1, 2, and 3, and highlighted with dedicated blocks. The rest of the employees, ranked 4 and lower, are listed in a table with their Rank (top to bottom, highest to lowest), Employee Name, and Plans Ended.
Important: Unlike total sales and plans sold metrics, employees with a top rank here may benefit more from sales coaching or assistance for managing plan customers that want to end their plan membership.
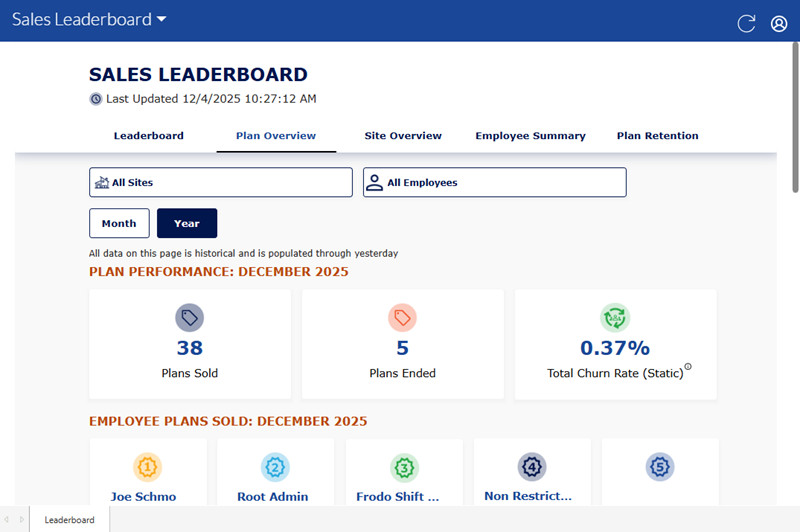
Plan Overview
Insights 2.0>Financial Outlook>Sales Leaderboard>Plan Overview
The Plan Overview dashboard provides key metrics such as: total plans sold (filterable by month, year, or employee), employees selling plans vs. average plans sold, and plans ended, including terminated or discontinuing statuses. Use it to assess plan health and individual contribution over time.
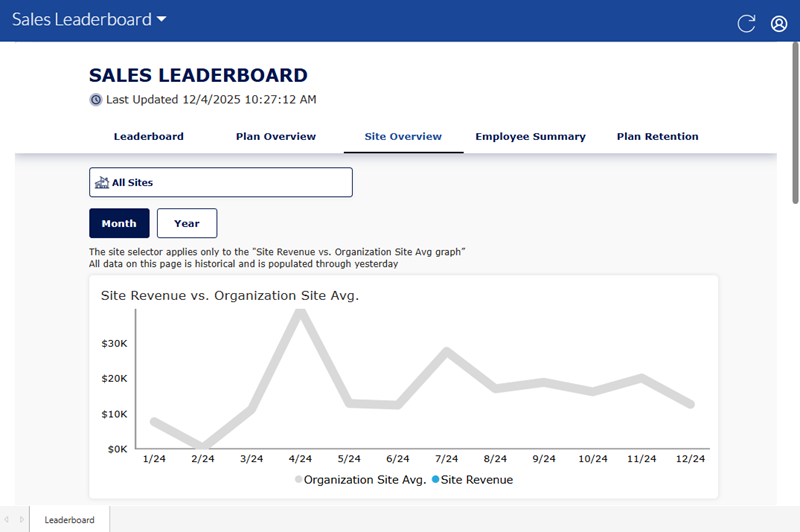
Site Overview
Insights 2.0>Financial Outlook>Sales Leaderboard>Site Overview
The Site Overview dashboard provides a snapshot of site performance and sales capture over time. It includes metrics on: eligible cars vs. plans sold (to identify conversion opportunities) and employee summaries, showing what each employee sold on a specific day, week, or month. Use it to monitor and review site-level sales consistency and employee engagement.
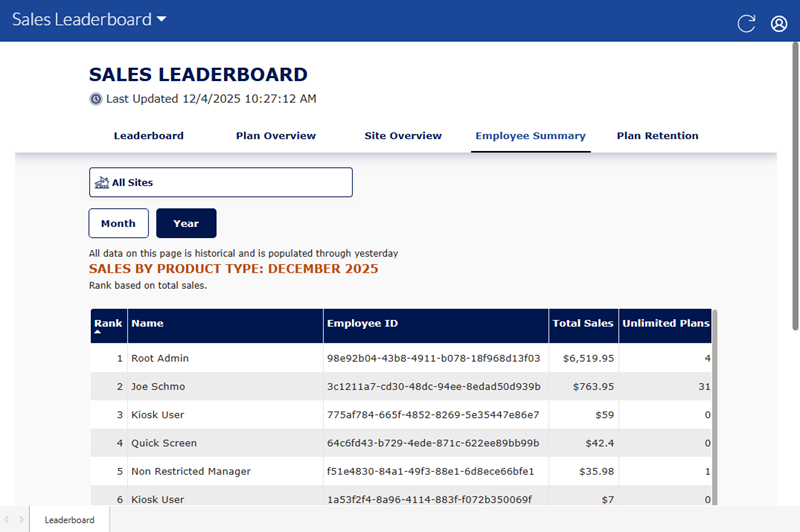
Employee Summary
Insights 2.0>Financial Outlook>Sales Leaderboard>Employee Summary
The Employee Summary dashboard provides an exportable table of all employees – on a daily, weekly, monthly or yearly cadence – and all of their sales for each product type.
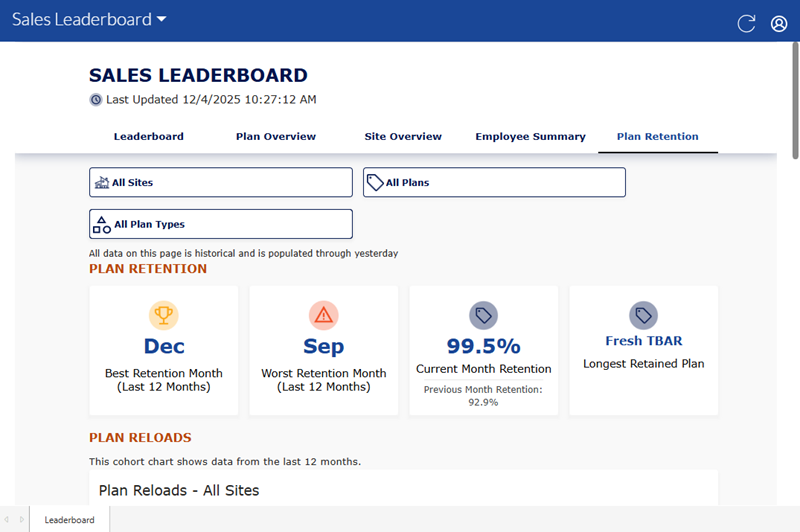
Plan Retention
Insights 2.0>Financial Outlook>Sales Leaderboard>Plan Retention
The Plan Retention dashboard tracks how long employees retain plans, measured in recurring payment cycles. Enables visibility into retention duration by employee, supporting long-term performance tracking and training opportunities.