Weather Dashboard
The Insights 2.0 Weather Dashboard provides the following weather-related metrics: number of cars washed, sales revenue per car, current day weather forecast, current day hourly weather forecast, and wash/weather almanac, for the selected site. The metrics are provided across four dashboards. Detailed information about each dashboard is provided below.
- Weather
- Weather Statistics
- Sales
- Almanac
Insights 2.0 dashboards are accessible from within Patheon Portal, or directly from any mobile device or desktop computer at Insights.DRB.com.
Patheon Portal
Mobile
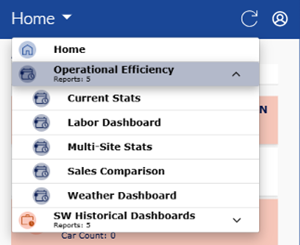
Dashboard Location
Insights 2.0>Operational Efficiency>Weather Dashboard
Dashboard Tools
The Weather Dashboard dashboard includes the following functions: refresh, sign out, last updated time and date, and select a site.
Refresh
Dashboards automatically refresh every 15 minutes. However, the dashboard header provides a refresh function to manually force a data refresh. When selected, it refreshes the data for all Insights 2.0 dashboards.
Note: Patheon Portal does not include the Refresh function. Use the web browser reload page function to manually refresh the data.
Sign Out
The user icon in the header provides a Sign Out function to sign out of Insights 2.0.

Last Updated
The date and time, based on the user's location, the dashboard data was last refreshed.
Important: Insights 2.0 dashboard data is near real-time. It reflects a 15-minute delay, so that the data can be processed and accurately rendered in the dashboards.

Select a Dashboard
The Weather Dashboard site selector is located below the last updated information.
Select a Site
Multi-site organizations can use the provided site selector to open a list of all sites within the organization, and then select a site to view its data in the dashboards.
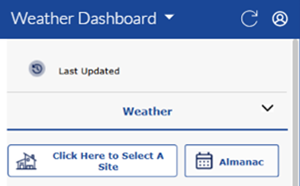
Selecting it opens a list with all sites. Users can navigate down the list and select any site. The list includes several other features.
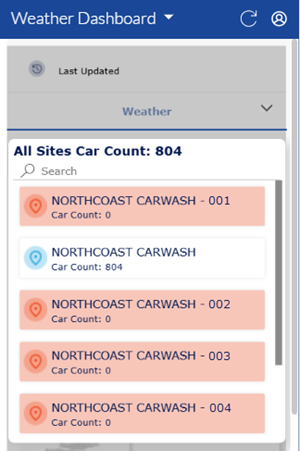
- All Sites Car Count: The top of the site list includes the sum of cars washed for all sites.
- Search: A search tool is available at the top of the site list for multi-site organizations that have a large number of sites. It can be used to quickly locate a site without navigating through the entire list. Note: The search function is case-sensitive.
- Car Count: Each site in the list includes its car count for the current day.
- Car Count: 0: Sites with a car count of 0 have a red background to alert users that no cars have been washed at that site for the current day. Sites with a car count of 1 or more have a white background in the list.
Almanac Shortcut
The Almanac shortcut provides quick access to the Almanac dashboard (see below).

Weather
Insights 2.0>Operational Efficiency>Weather Dashboard>Weather
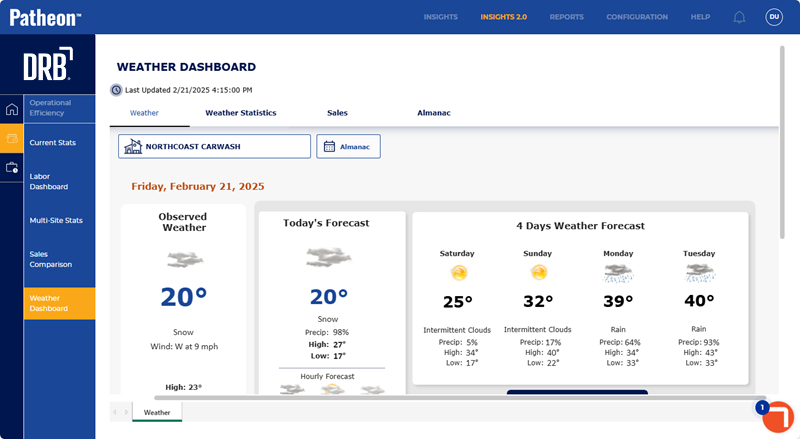
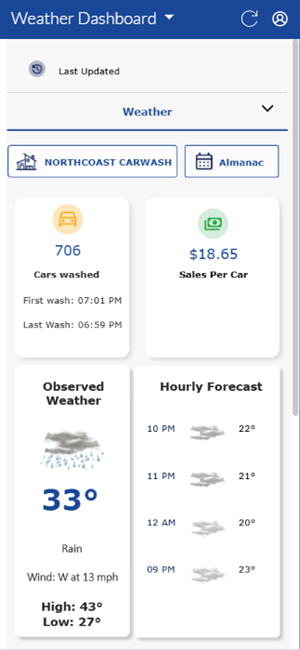
The Weather dashboard provides stats for the number of cars washed and sales revenue per car, along with current weather and hourly forecast, for the selected site (based on the zip code configured for the site in Patheon Portal).
Patheon Portal

Mobile

Cars washed
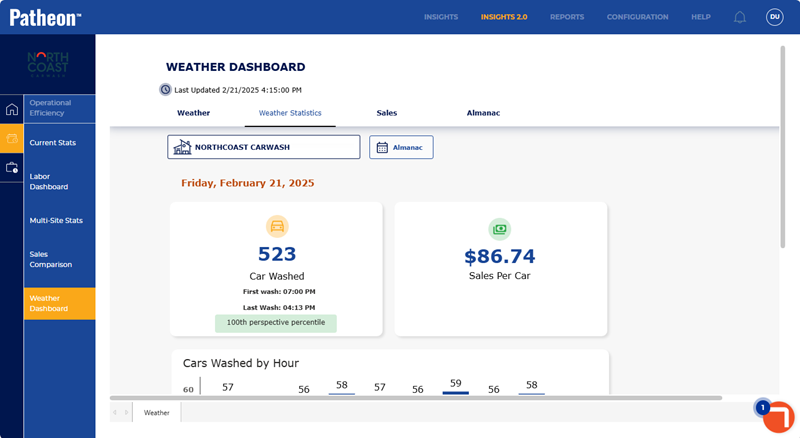
The number of cars washed for the current day, for the selected site. It includes the First wash and Last Wash.
Sales Per Car
The average sales amount for each sale with a wash for the current day, for the selected site.
Observed Weather
The current weather, for the selected site.
Hourly Forecast
The hourly weather forecast for the selected site.
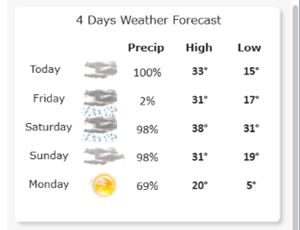
4 Days Weather Forecast
The 4 Days Weather Forecast provides the cloud cover forecast, precipitation chance, high temperature, and low temperature, for the current day and next 4 days, for the selected site.
VIEW WEATHER ALMANAC
The function provides quick access to the Almanac dashboard (see below).

Weather Statistics
Insights 2.0>Operational Efficiency>Weather Dashboard>Weather Statistics
The Weather Statistics weather dashboard provides statistics for the average number of cars washed per hour, for the selected site.
Patheon Portal
Mobile
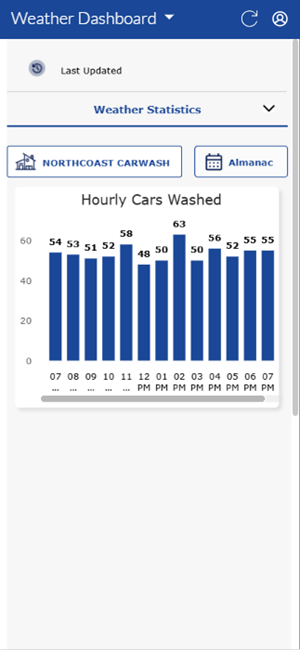
Hourly Cars Washed
The average number of cars washed per hour for the current day, for the selected site.
Sales
Insights 2.0>Operational Efficiency>Weather Dashboard>Sales
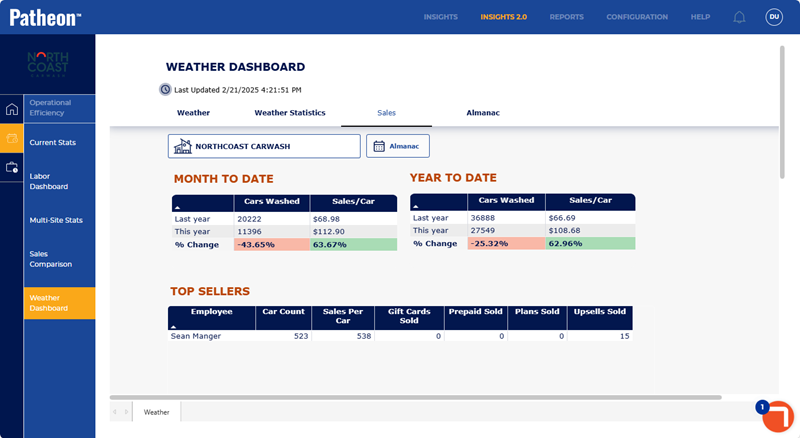
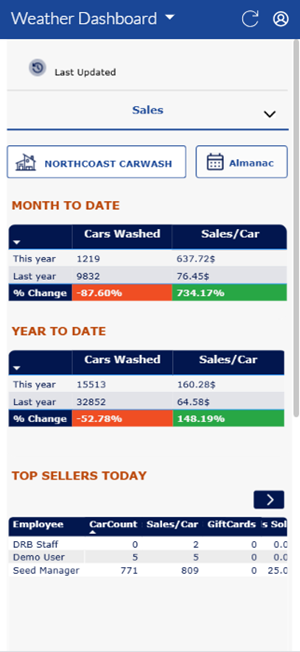
The Sales weather dashboard provides cars washed and sales/car statistics for month to date and year to date, as well as the top sellers by product for the current day, and sales per product, for the selected site.
Patheon Portal
Mobile
MONTH TO DATE
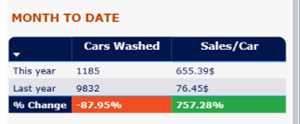
The Month to Date section provides month-to-date stats for cars washed and sales/car for the current year and previous year, for the selected site.
Cars Washed
The total count of cars that received a wash for the current month-to-date, for the selected site. The statistic is provided for both the current year (This year) and previous year (Last year) for comparison, with the difference between the two reported as a percentage (% Change). If the current year is higher than the previous year, the percentage is a positive percentage (increase) with a green background. If the current year is lower than the previous year, the percentage is a negative percentage (decrease) with a red background.
Sales/Car
The average revenue per car that received a wash for the current month-to-date, for the selected site. The statistic is provided for both the current year (This year) and previous year (Last year) for comparison, with the difference between the two reported as a percentage (% Change). If the current year is higher than the previous year, the percentage is a positive percentage (increase) with a green background. If the current year is lower than the previous year, the percentage is a negative percentage (decrease) with a red background.
YEAR TO DATE
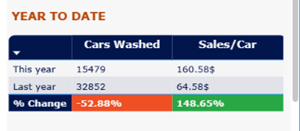
The Year to Date section provides
Cars Washed
The total count of cars that received a wash for the current year-to-date, for the selected site. The statistic is provided for both the current year (This year) and previous year (Last year) for comparison, with the difference between the two reported as a percentage (% Change). If the current year is higher than the previous year, the percentage is a positive percentage (increase) with a green background. If the current year is lower than the previous year, the percentage is a negative percentage (decrease) with a red background.
Sales/Car
The average revenue per car that received a wash for the current year-to-date, for the selected site. The statistic is provided for both the current year (This year) and previous year (Last year) for comparison, with the difference between the two reported as a percentage (% Change). If the current year is higher than the previous year, the percentage is a positive percentage (increase) with a green background. If the current year is lower than the previous year, the percentage is a negative percentage (decrease) with a red background.
TOP SELLERS TODAY
The Top Sellers Today section provides the following statistics for each employee who recorded at least one sale for the current day: car count, sales/car, gift cards sold, prepaids sold, plans sold, and upsells sold.
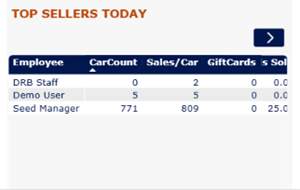
Employee
The Employee column provides the name of each employee who recorded at least one sale for the current day.
The column can be sorted in ascending or descending alphanumerical order by selecting its header.
CarCount
The CarCount column provides the total number of sales to which the employee was assigned that included a wash for the current day.
The column can be sorted in ascending or descending numerical order by selecting its header.
Sales/Car
The Sales/Car column provides the average revenue per car for sales to which the employee was assigned, for the current day.
The column can be sorted in ascending or descending numerical order by selecting its header.
GiftCards Sold
The GiftCards Sold column provides the total number of sales to which the employee was assigned that included the sale of a gift card, for the current day.
The column can be sorted in ascending or descending numerical order by selecting its header.
Prepaid Sold
The Prepaid Sold column provides the total number of sales to which the employee was assigned that included the sale of a prepaid, for the current day.
The column can be sorted in ascending or descending numerical order by selecting its header.
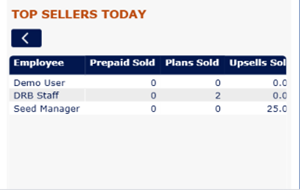
Plans Sold
The Plans Sold column provides the total number of sales to which the employee was assigned that included the sale of a wash plan, for the current day.
The column can be sorted in ascending or descending numerical order by selecting its header.
Upsells Sold
The GiftCards Sold column provides the total number of sales to which the employee was assigned that included the sale of an upsell product, for the current day.
The column can be sorted in ascending or descending numerical order by selecting its header.
SALES PER PRODUCT
The Sales per Product section provides statistics for the total count of each wash service sold and the percentage of cars that purchased that service.
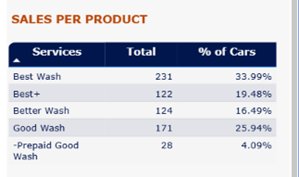
Services
The Services column provides a list of all washes that have been sold for the current day, for the selected site.
The column can be sorted in ascending or descending alphanumerical order by selecting its header.
Total
The Total column provides the number of each corresponding wash service that has been sold for the current day, for the selected site.
The column can be sorted in ascending or descending numerical order by selecting its header.
% of Cars
The % of Cars column provides the percentage of all wash sales that included the corresponding wash service that has been sold for the current day, for the selected site.
The column can be sorted in ascending or descending numerical order by selecting its header.
Almanac
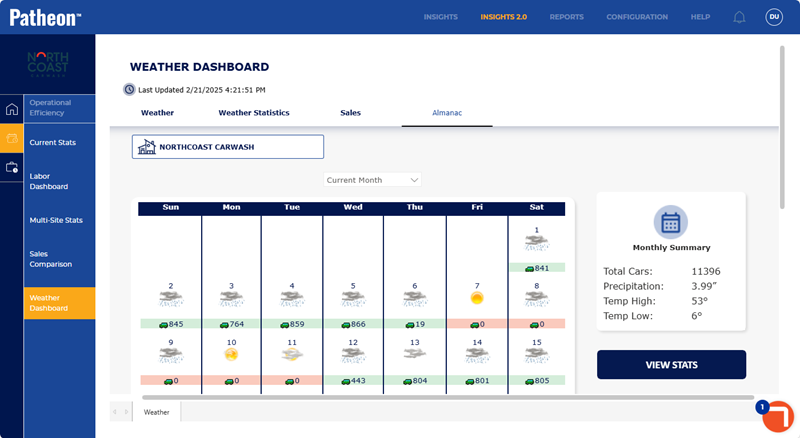
Insights 2.0>Operational Efficiency>Weather Dashboard>AlmanacThe Almanac weather dashboard provides a high-level overview of the weather and car count for previous days.
Patheon Portal
Mobile
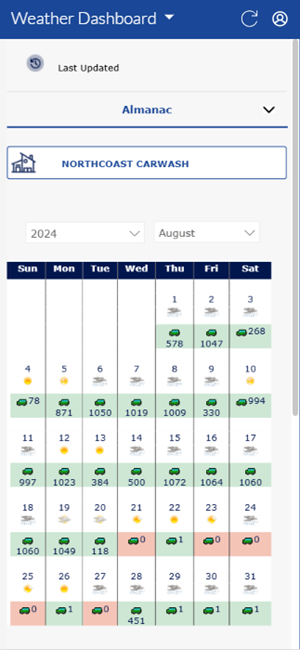
Almanac Calendar
The Almanac Calendar includes a year selector and month selector to view a summary of each day for a specific month and year.
The summary data for each day includes a graphic that reflects that day's weather (a sun graphic for sunny weather, a cloud graphic for overcast weather, etc.) and the number of cars washed that day.
Important: Selecting a day from the almanac calendar replaces the Monthly Summary with Day Details, which provides the following data for the selected date: total cars, total precipitation, high temperature, and low temperature. See Day Details below for more information.
Monthly Summary
A Monthly Summary is provided below the almanac calendar. It provides the following summarized information for the selected month: total cars, precipitation, highest temperature, and lowest temperature.
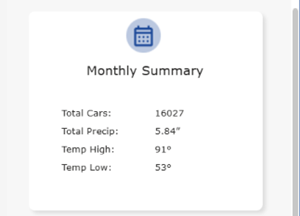
Total Cars
The Total Cars metric provides the total number of cars washed, for the selected month.
Total Precip
The Total Precip metric provides the total precipitation accumulated (in inches), for the selected month.
Temp High
The Temp High metric provides the highest temperature recorded (in Fahrenheit), for the selected month.
Temp Low
The Temp High metric provides the lowest temperature recorded (in Fahrenheit), for the selected month.
Day Details
A Day Details section replaces the Monthly Summary section if a specific day is selected from the almanac calendar. It provides the following information for the selected day: total cars, precipitation, highest temperature, and lowest temperature.
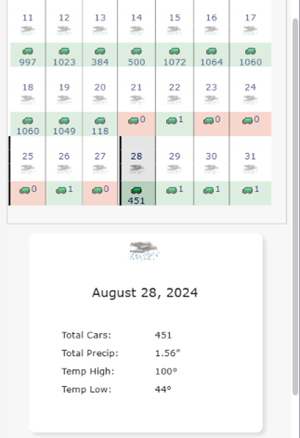
Total Cars
The Total Cars metric provides the total number of cars washed, for the selected day.
Total Precip
The Total Precip metric provides the total precipitation accumulated (in inches), for the selected day.
Temp High
The Temp High metric provides the highest temperature recorded (in Fahrenheit), for the selected day.
Temp Low
The Temp High metric provides the lowest temperature recorded (in Fahrenheit), for the selected day.
View Stats
A View Stats function is provided at the bottom of the dashboard. Use it to close the Almanac weather dashboard and open the Weather weather dashboard.
