Sales Insights
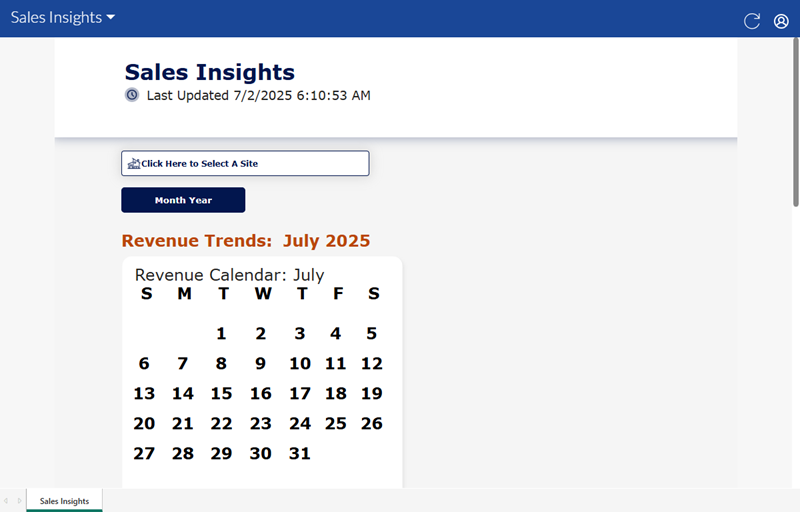
The Insights 2.0 Sales Insights dashboard provides visibility into revenue trends, wash performance, and sales metrics. This dashboard supports performance tracking and helps surface patterns across time and product types. Organizations can use it to easily view daily revenue in a calendar layout to spot high- and low-performing days, track revenue trends over time with intuitive time series charts, compare revenue per car to understand operational efficiency, and review monthly plan and wash metrics, including sales revenue, discounts, sales count, and net revenue.
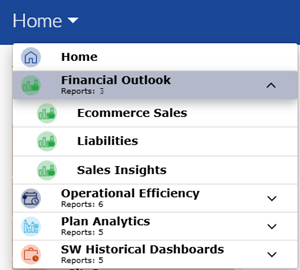
Insights 2.0 dashboards are accessible from within Patheon Portal, or directly from any mobile device or desktop computer at Insights.DRB.com.
Dashboard Location
Insights 2.0>Financial Outlook>Sales Insights
Dashboard Tools
The Sales Insights dashboard provides the following functions and information: refresh, sign out, and last updated time and date.
Refresh
Dashboards automatically refresh every 15 minutes. However, the dashboard header provides a refresh function to manually force a data refresh. When selected, it refreshes the data for all Insights 2.0 dashboards.

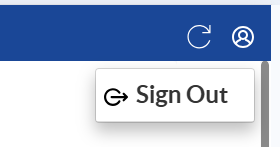
Sign Out
The user icon in the header provides a Sign Out function to sign out of Insights 2.0.
Last Updated
The date and time, based on the user's location, the dashboard data was last refreshed.

Important: Insights 2.0 dashboard data is near real-time. It reflects a 15-minute delay, so that the data can be processed and accurately rendered in the dashboards.
Site
The Site function provides the ability to select a specific site, multiple select-sites, or all sites for the dashboard data.
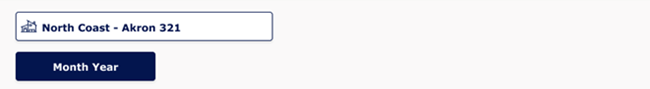
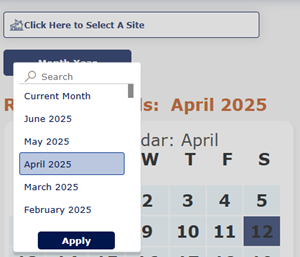
Month Year
The Month Year function provides the ability to select a specific month and year for the dashboard data.
Revenue Trends
The Revenue Trends section provides a calendar, revenue graph, and revenue per car graph.
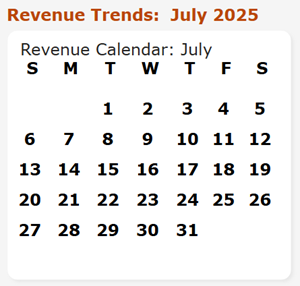
Revenue Calendar
The Revenue Calendar displays the selected calendar month.
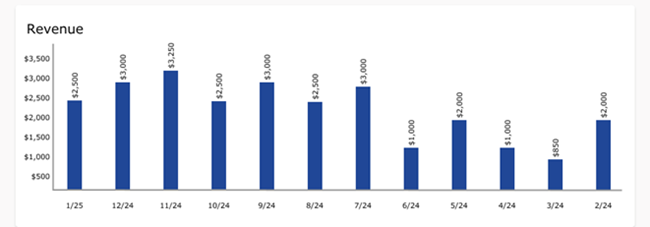
Revenue
The Revenue graph provides the total revenue recorded each month, for the selected month and the months prior to it.
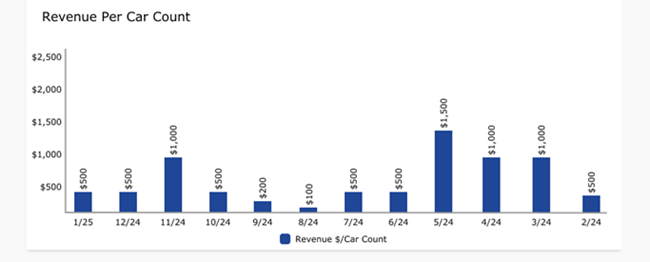
Revenue Per Car Count
The Revenue Per Car Count graph provides the average revenue recorded per car (sale) for the selected month and the months prior to it.
PLAN WASH STATISTICS
The Plan Wash Statistics section provides a table that provides sales revenue, discount revenue, sales count, and net revenue.
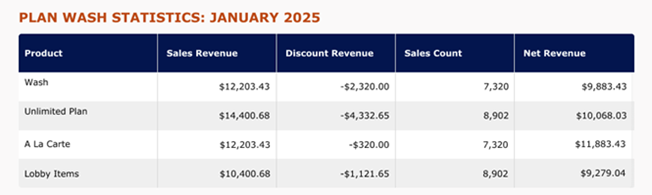
Product
The Product column provides the name of each product type.
The column can be sorted in ascending or descending alphanumerical order by selecting its header.
Sales Revenue
The Sales Revenue column provides the total amount recorded, before discounts, for the corresponding product type, for the selected time period.
The column can be sorted in ascending or descending numerical order by selecting its header.
Discount Revenue
The Discount Revenue column provides the total discount amount recorded for the corresponding product type, for the selected time period.
The column can be sorted in ascending or descending numerical order by selecting its header.
Sales Count
The Sales Count column provides the number of sales that included the corresponding product type, for the selected time period.
The column can be sorted in ascending or descending numerical order by selecting its header.
Net Revenue
The Net Revenue column provides the difference, in amount, between the corresponding Sales Revenue and Discount Revenue, for the selected time period.
The column can be sorted in ascending or descending numerical order by selecting its header.