FastID+ Insights Dashboard
The FastID+ Insights Dashboard page provides an overview of vehicle activity captured by the FastID+ system across all configured wash locations and cameras. Use this page to review live and historical activity through charts, summary metrics, and a detailed vehicle records table.
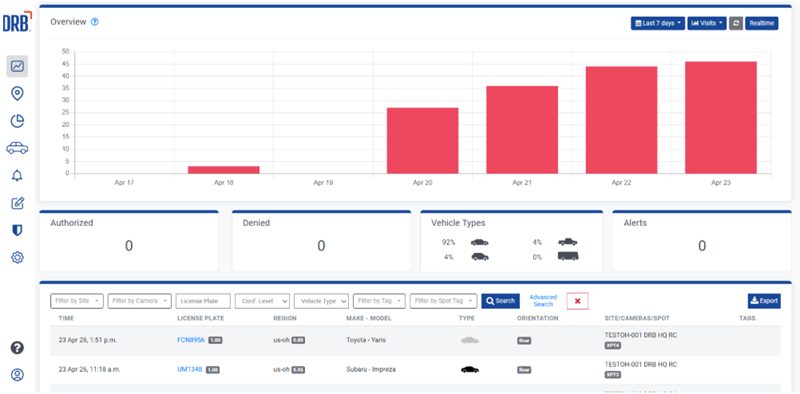
- Review vehicle visit activity for a selected date range
- Switch to
Realtime mode to watch new detections as they occur - View summary cards for top vehicle tags, vehicle type breakdown, and alert counts
- Filter records by site, camera, plate, confidence level, vehicle type, and tag
- Use
Advanced Search to filter by make, model, color, and region code - Sort table columns and export filtered results to CSV
- Hover over records to preview vehicle and license plate images
Overview
At the top of the page, an interactive Overview chart displays customer visits for the selected time period. In the Visits view, the chart shows total vehicle visits as a bar graph. Each bar represents the number of visits for a specific time interval, such as daily visits over the last 7 days.
When multiple wash locations are included, the chart uses color-coded bars to distinguish activity by site.
Time Period Selection
By default, the Dashboard shows data for the last 7 days. You can change the date range by using the date selector in the upper-right corner of the page.
- Select a predefined date range, such as the last 24 hours, last 7 days, or last 30 days.
- Select a custom date range with a specific start date and end date.
View Live Visits
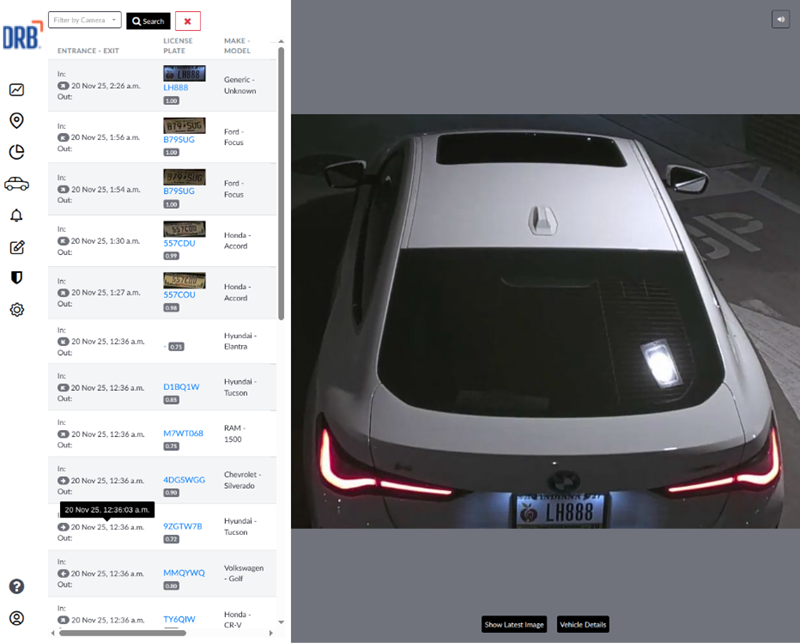
You can monitor incoming vehicle activity in a live, automatically refreshing view across all connected cameras and locations.
- Open the Dashboard page.
- Click Realtime in the upper-right corner to enable real-time mode.
- Watch the feed update as new vehicle reads are received.
- Click Realtime again to turn real-time mode off.
The page refreshes automatically as new vehicles are detected.
A timer shows how long it has been since the most recent refresh.
Summary Statistics
Below the chart, summary cards provide a quick snapshot of recent activity.
Custom Vehicle Tags
Tag summary cards display the custom vehicle tags with activity during the selected time period. The tags with the highest number of matching visits appear for quick reference.
Vehicle Types
This summary shows the distribution of detected vehicle types and their percentages for the selected period.
Alerts
This card shows the total number of alerts triggered during the selected time range. Selecting this card opens the Alerts page for more detail.
Filtering Vehicle Records
The dashboard includes filter options to help you locate specific vehicle records.
Basic Filters
- Site: Filter records by location.
- Camera: Filter records by camera source.
- License Plate: Search for a specific plate number.
- Conf. Level: Filter by LPR read confidence in 10% increments.
- Vehicle Type: Filter by vehicle type.
- Tag: Filter by assigned vehicle tags.
Advanced Search
Click Advanced Search to show additional filtering options.
- Make: Filter by vehicle manufacturer.
- Model: Filter by vehicle model.
- Colors: Filter by vehicle color.
- Region Code: Filter by license plate region.
Search Actions
Search functions are provided to initiate a start based on the selected filters, open the standard filter view, clear all selected filters, and export results.

- Search: Apply the selected filters.
- Basic Search: Return to the standard filter view.
- X: Clear all applied filters.
- Export: Export the filtered results to a CSV file.
Vehicle Records Table
The main table lists detailed information for each detected vehicle record.
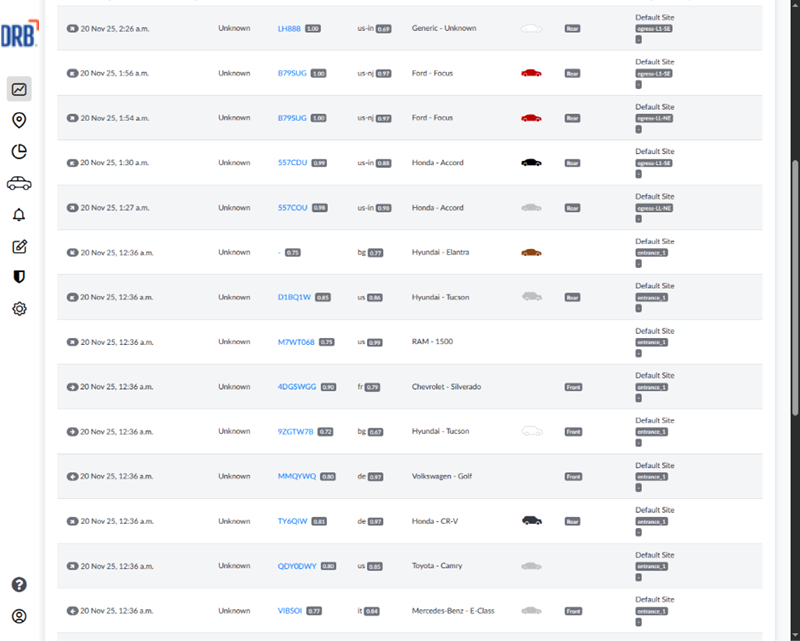
Table Columns
- Entrance: The entry date and time for the vehicle detection.
- License Plate: The detected plate number and confidence score.
- Region: The detected plate region and confidence score.
- Make - Model: The recognized vehicle make and model.
- Type: The vehicle type classification.
- Orientation: The detected vehicle orientation.
- Site/Cameras/Spot: The site and camera associated with the read.
- Tags: Tags assigned to the vehicle record.
Interactive Features
Vehicle Image Preview
Move the pointer over a vehicle record in the table to display an image preview and related details.
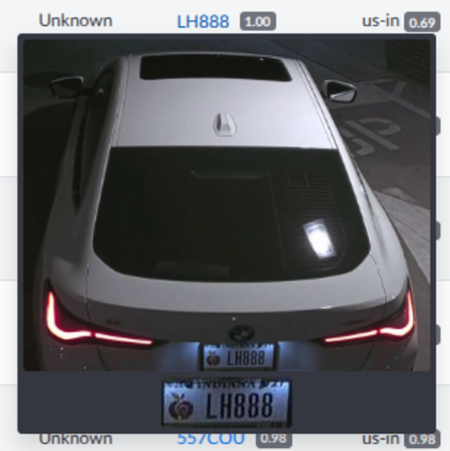
- A preview window shows the captured vehicle image.
- The plate image can be reviewed for verification.
- Vehicle details such as make, model, and region are displayed.
This feature helps staff verify vehicle identification without leaving the Dashboard page.
Sortable Columns
Select supported column headers to sort table results.
- Entrance: Sort by entry time in ascending or descending order.
- Exit: Sort by exit time in ascending or descending order when available.
- Other columns may also support sorting depending on the data shown.
Export Data
To export vehicle records for the selected time period:
- Apply any desired filters to narrow down the data
- Click the Export button in the top-right corner
- The data will be downloaded in CSV format, including all visible columns and filtered records
This is useful for:
- Creating reports for management
- Analyzing patterns
- Integrating with external systems
- Archiving historical data