Labor Dashboard
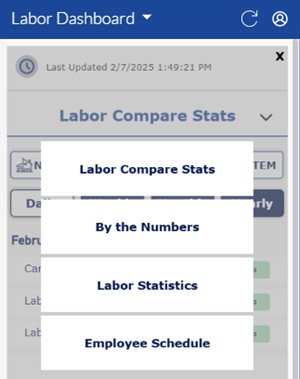
The Insights 2.0 Labor Dashboard provides site-specific statistics for the following metrics: labor comparison, by the numbers, labor statistics, and employee schedule. However, it is only available for sites that have one of the following labor integrations with Patheon: ADP or Deputy. The Labor Dashboard dashboard is comprised of four dashboards. Detailed information about each dashboard is provided below.
- Labor Compare Stats
- By the Numbers
- Labor Statistics
- Employee Schedule
Insights 2.0 dashboards are accessible from within Patheon Portal, or directly from any mobile device or desktop computer at Insights.DRB.com.
Dashboard Location
Insights 2.0>Operational Efficiency>Labor Dashboard
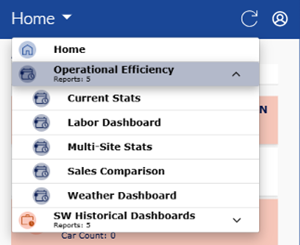
Dashboard Tools
The Labor Dashboard includes the following functions: refresh, sign out, last updated time and date, select a dashboard tool, and select a site tool.
Refresh
Dashboards automatically refresh every 15 minutes. However, the dashboard header provides a refresh function to manually force a data refresh. When selected, it refreshes the data for all Insights 2.0 dashboards.
Note: Patheon Portal does not include the Refresh function. Use the web browser reload page function to manually refresh the data.
Sign Out
The user icon in the header provides a Sign Out function to sign out of Insights 2.0.

Last Updated
The date and time, based on the user's location, the dashboard data was last refreshed.
Important: Insights 2.0 dashboard data is near real-time. It reflects a 15-minute delay, so that the data can be processed and accurately rendered in the dashboards.

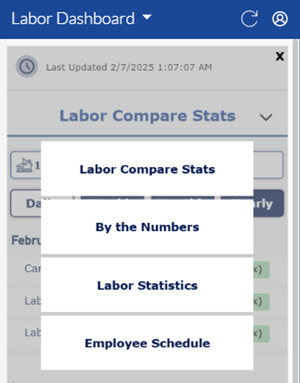
Select a Dashboard
The Labor Dashboard dashboard selector is located below the last updated information.
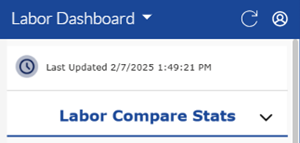
Selecting it opens the Labor Dashboard dashboard menu.
Select a Site
The Labor Dashboard site selector is located below the dashboard selector.
![]()
Selecting the current site opens a list with all sites. Users can navigate down the list and select any site. The list includes the following features: total cars, site search, and 0 car count highlighting.
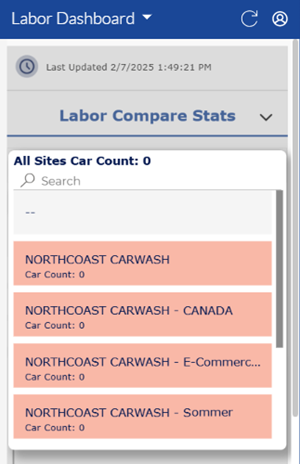
- All Sites Car Count: The top of the site list includes the sum of cars washed for all sites.
- Search: A search tool is available at the top of the site list for multi-site organizations that have a large number of sites. It can be used to quickly locate a site without navigating through the entire list. Note: The search function is case-sensitive.
- Car Count: Each site in the list includes its car count for the current day.
- Car Count: 0: Sites with a car count of 0 have a light red background shading in the list to alert users that no cars have been washed at that site for the current day. Sites with a car count of 1 or more have a white (no shading) background in the list.
Labor Compare Stats
Insights 2.0>Operational Efficiency>Labor Dashboard>Labor Compare Stats
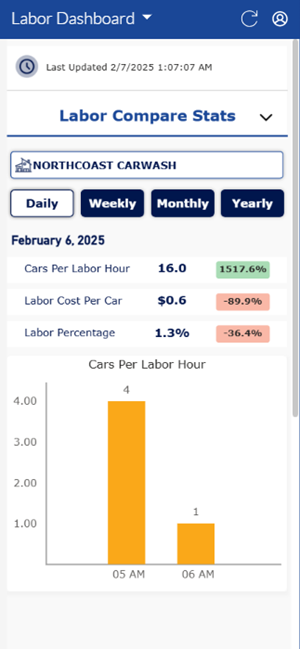
The Labor Compare Stats dashboard provides the following data points for a site: cars per labor hour (daily, weekly, monthly, and yearly), labor cost per car, and labor percentage (daily, weekly, monthly and yearly time periods.

Daily
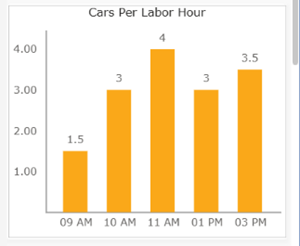
The labor compare stats Daily dashboard provides the following three data points for a specific day: cars per labor hour, labor cost per car, and labor percentage. Additionally, it includes a bar graph that provides cars per labor hour for each hour of the day.
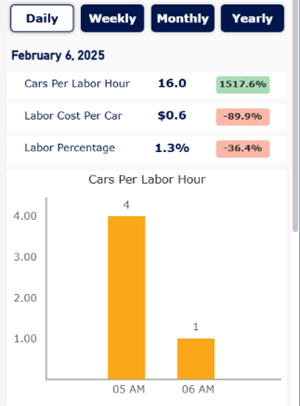
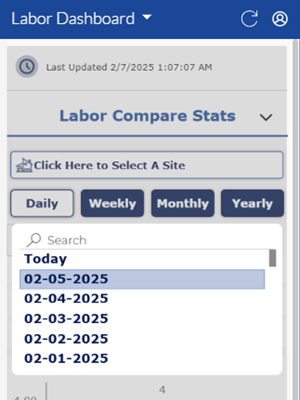
By default, it displays the current day. However, stats for a previous day can be viewed by selecting Daily and choosing a different date.
Cars Per Labor Hour
The Cars Per Labor Hour metric provides the average number of cars washed per labor hour for the selected site and day. Important: Note that this is the per hour average for the entire day. The cars per labor hour for each hour of the day is provided in the graph below this section.
Labor Cost Per Car
The Labor Cost Per Car metric provides the average labor cost per car for the selected week.
Labor Percentage
The Labor Percentage metric provides the percent of labor cost per car for the selected week.
Cars Per Labor Hour (Graph)
The Cars Per Labor Hour graph provides the average number of cars washed per labor hour for each hour for the selected day. This is different from the metric above, which provides the average cars per labor hour for the entire day.
Weekly
The labor compare stats Weekly dashboard provides the following three data points for a specific week (Sunday-Saturday): cars per labor hour, labor cost per car, and labor percentage. Additionally, it includes a bar graph that provides cars per labor hour for each day of the week.
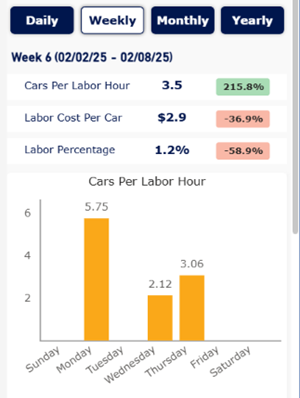
By default, it displays the current week. However, stats for a previous week can be viewed by selecting Weekly and choosing a different week.
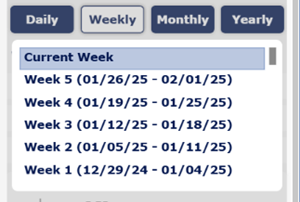
Cars Per Labor Hour
The Cars Per Labor Hour metric provides the average number of cars washed per labor hour for the selected site and week. Important: Note that this is the per hour average for the entire week. The cars per labor hour for each day of the week is provided in the graph below this section.
Labor Cost Per Car
The Labor Cost Per Car metric provides the average labor cost per car for the selected week.
Labor Percentage
The Labor Percentage metric provides the percent of labor cost per car for the selected week.
Cars Per Labor Hour (Graph)
The Cars Per Labor Hour graph provides the average cars washed per labor hour for each day of the selected week. This is different from the metric above, which provides the average cars per labor hour for the entire week.
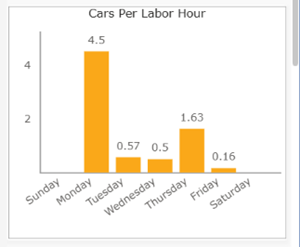
Monthly
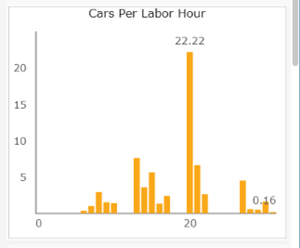
The Monthly labor compare stats dashboard provides the following three data points for a specific month: cars per labor hour, labor cost per car, and labor percentage. Additionally, it includes a bar graph that provides cars per labor hour for each day of the month.
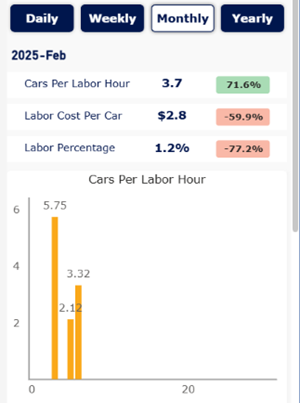
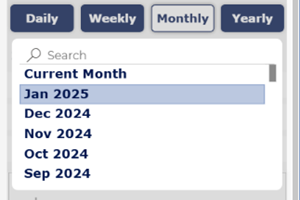
By default, it displays the current month. However, stats for a previous month can be viewed by selecting Monthly and choosing a different month.
Cars Per Labor Hour
The Cars Per Labor Hour metric provides the average number of cars washed per labor hour for the selected site and month. Important: Note that this is the per hour average for the entire month. The cars per labor hour for each day of the month is provided in the graph below this section.
Labor Cost Per Car
The Labor Cost Per Car metric provides the average labor cost per car for the selected month.
Labor Percentage
The Labor Percentage metric provides the percent of labor cost per car for the selected month.
Cars Per Labor Hour (Graph)
The Cars Per Labor Hour graph provides the average cars washed per labor hour for each day of the selected month. This is different from the metric above, which provides the average cars per labor hour for the entire month.
Yearly
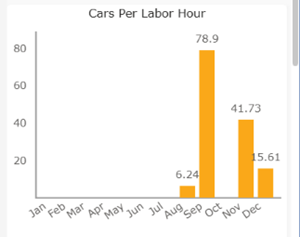
The Yearly labor compare stats dashboard provides the following three data points for a specific year: cars per labor hour, labor cost per car, and labor percentage. Additionally, it includes a bar graph that provides cars per labor hour for each month of the year.
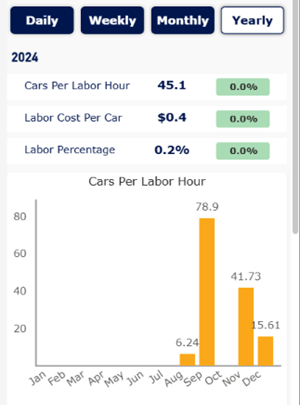
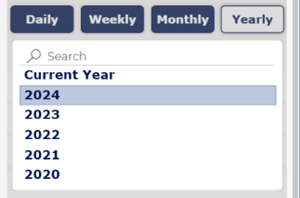
By default, it displays the current year. However, stats for a previous year can be viewed by selecting Yearly and choosing a different year.
Cars Per Labor Hour
The Cars Per Labor Hour metric provides the average number of cars washed per labor hour for the selected site and year. Important: Note that this is the per hour average for the entire year. The cars per labor hour for each month of the year is provided in the graph below this section.
Labor Cost Per Car
The Labor Cost Per Car metric provides the average labor cost per car for the selected year.
Labor Percentage
The Labor Percentage metric provides the percent of labor cost per car for the selected year.
Cars Per Labor Hour (Graph)
The Cars Per Labor Hour graph provides the average cars washed per labor hour for each month of the selected year. This is different from the metric above, which provides the average cars per labor hour for the entire year.
By the Numbers
Insights 2.0>Operational Efficiency>Labor Dashboard>By the Numbers
The By the Numbers dashboard provides the following data points for the current day, for the selected site: cars per labor hours (daily and hourly), labor cost per car (daily and hourly), and labor percentage (daily and hourly).
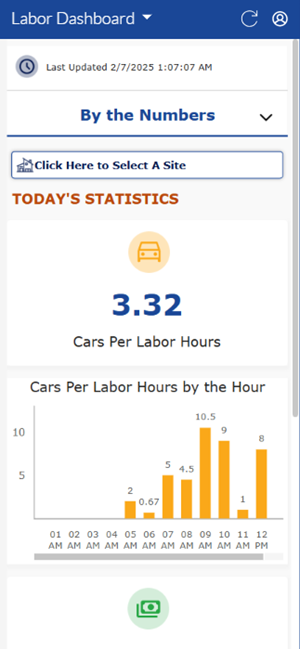
The By the Numbers dashboard is accessible from Insights 2.0 within Patheon Portal or directly from insights.drb.com on a mobile device or desktop computer.
TODAY'S STATISTICS
The Today's Statistics section provides the following metrics: cars per labor hour, cars per labor hour by the hour, labor cost per car, labor cost per car by the hour, labor percentage, and labor percentage by the hour.
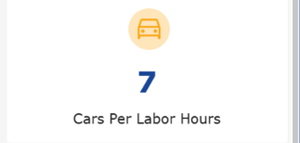
Cars Per Labor Hour
The Cars Per Labor Hour metric provides the total cars for the day divided by total labor hours for the day.
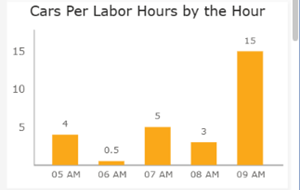
Cars Per Labor Hour by the Hour
The Cars Per Labor Hour by the Hour metric provides the total cars for each hour divided by total labor hours for each hour for the day.
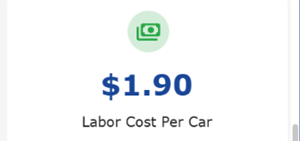
Labor Cost Per Car
The Labor Cost Per Car metric provides the total labor dollars for the day divided by total cars for the day.
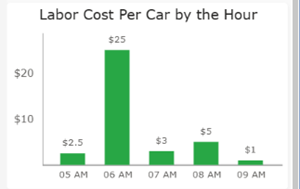
Labor Cost Per Car by the Hour
The Labor Cost Per Car by the Hour metric provides the total labor dollars for each hour divided by total cars for each hour for the day.
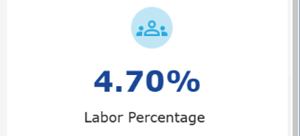
Labor Percentage
The Labor Percentage metric provides the total labor cost for the day divided by the total sales for the day, and then multiplied by 100.
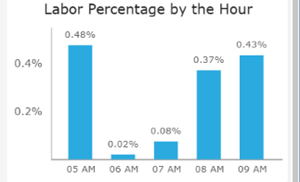
Labor Percentage by the Hour
The Labor Percentage by the Hour metric provides the total labor cost for each hour divided by the total sales for each hour for the day, and then multiplied by 100.
Labor Statistics
Insights 2.0>Operational Efficiency>Labor Dashboard>Labor Statistics
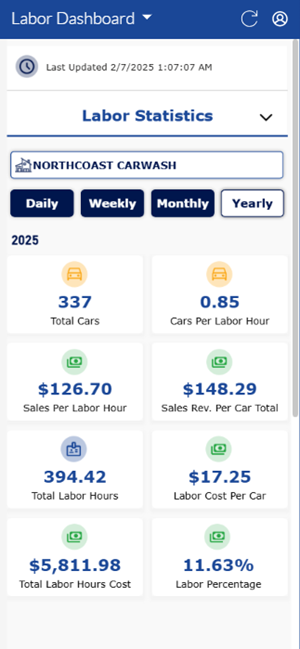
The Labor Statistics dashboard provides the following data points for a site: total cars, cars per labor hour, sales per labor hour, sales revenue per car total, total labor hours, labor cost per car, total labor hours cost, and labor percentage. These stats are all available for a specific day, week, month, or year.
Total Cars
The Total Cars metric provides a count of all cars washed for the selected site.

Cars Per Labor Hour
The Cars Per Labor Hour metric provides the average number of cars washed per labor hour for the selected site.

Sales Per Labor Hour
The Sales Per Labor Hour metric provides the average number of sales tendered per labor hour for the selected site.

Sales Rev. Per Car Total
The Sales Rev. Per Car Total metric provides the average dollar amount received per washed car for the selected site.

Total Labor Hours
The Total Labor Hours metric provides the total number of labor hours recorded for the selected site.

Labor Cost Per Car
The Labor Cost Per Car metric provides the average dollar amount for labor per wash car, for the selected site.

Total Labor Hours Cost
The Total Labor Hours Cost metric provides the total dollar amount for labor, for the selected site.

Labor Percentage
The Labor Percentage metric provides total labor cost divided by total sales, then multiplied by 100, for the selected site.

Employee Schedule
Insights 2.0>Operational Efficiency>Labor Dashboard>Employee Schedule
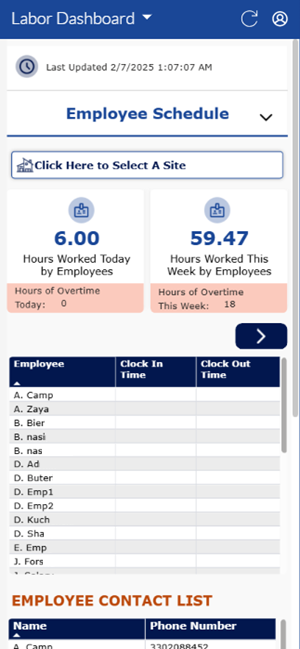
The Employee Schedule dashboard provides the following data points for the selected site:: total hours worked by employees for the current day, total hours worked by employees for the current week, specific employee timeclock data (clock in/out time for current day, hours worked current day, hours worked current week, current overtime hours, and number of days out the next 7 days).
Hours Worked Today by Employees
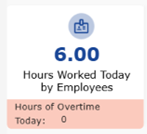
The Hours Worked Today by Employees metric is the total number of hours worked today for all employees at the selected site. Hours only accumulate here after an employee clocks out. A separate overtime hours data point is also provided.
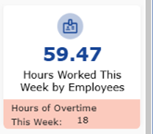
Hours Worked This Week by Employees
The Hours Worked This Week by Employees metric is the total number of hours worked for the current week for all employees at the selected site. Hours only accumulate here after an employee clocks out. A separate overtime hours data point is also provided.
Employee Timeclock Stats
The Employee Timeclock Stats metric is the following timeclock stats are provided for all employees at the selected site: clock in time, clock out time, hours worked for the current day, hours worked for the current week, overtime hours, and scheduled time off for the next 7 days.
Important: Employee timeclock stats are not site-specific. Timeclock stats are provided across all sites so operators can identify whether an employee is near or has exceeded overtime.
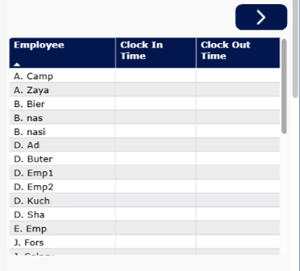
Employee
The Employee column provides the name, in first initial and last name format, of each employee.
The column can be sorted (by first initial, not last name) in ascending or descending alphanumerical order by selecting its header.
Clock In Time
The Clock In Time column provides the clock in time and date, in format similar to 07:00 AM 02/06/25, for an employee.
The column can be sorted in ascending or descending numerical order by selecting its header.
Clock Out Time
The Clock Out Time column provides the clock out time and date, in format similar to 05:00 PM 02/06/25, for an employee.
The column can be sorted in ascending or descending numerical order by selecting its header.
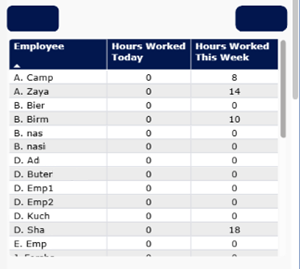
Hours Worked Today
The Hours Worked Today column provides the number of hours the employee worked today. Important: Time only shows here after the employee clocks out.
The column can be sorted in ascending or descending numerical order by selecting its header.
Hours Worked This Week
The Hours Worked This Week column provides the number of hours the employee worked for the current week.
The column can be sorted in ascending or descending numerical order by selecting its header.
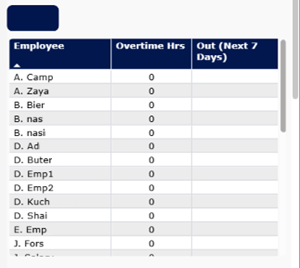
Overtime Hrs
The Overtime Hrs column provides the number of overtime hours recorded for the employee. Important: Overtime only shows here after the employee clocks out.
The column can be sorted in ascending or descending numerical order by selecting its header.
Out (Next 7 Days)
The Out (Next 7 Days) column provides the dates, in MM/DD format, the employee is scheduled to be out the next 7 days. If there are multiple dates, each date is listed individually, separated by a comma.
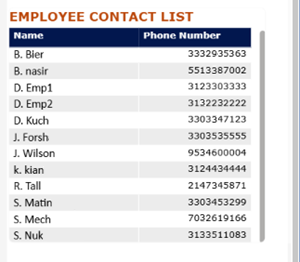
EMPLOYEE CONTACT LIST
The Employee Contact List section provides a table with each employee and their phone number.
Name
The Name column provides the name, in first initial and last name format, of each employee.
The column can be sorted (by first initial, not last name) in ascending or descending alphanumerical order by selecting its header.
Phone Number
The Phone Number column provides the phone number, in 1234567890 format, of each employee.
The column can be sorted in ascending or descending numerical order by selecting its header.