SW Historical Labor Statistics
The SW Historical Labor Statistics dashboard provides the following summarized SiteWatch labor data: cars per labor hour, labor cost per car, labor percentage, and sales per labor hour. It is similar to the Insights 2.0 Multi-Site Stats dashboard, which provides Patheon data. The data can be filtered each month, up to 24 months from a site's SiteWatch-to-Patheon conversion month (depending on the availability of historical data from its SiteWatch Server). The data is static; it does not include live or current data. It only includes historical SiteWatch data. Detailed information about the dashboard is provided below.
- Labor Statistics
Insights 2.0 dashboards are accessible from within Patheon Portal, or directly from any mobile device or desktop computer at Insights.DRB.com.
Dashboard Location
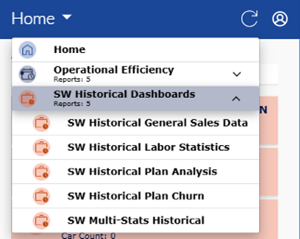
Insights 2.0>SW Historical Dashboards>SW Historical Labor Statistics
Dashboard Tools
The SW Historical Labor Statistics dashboard includes the following functions: refresh, sign out, select a site tool, and select a time period tool.
Refresh
The dashboard header provides a refresh function to manually force a data refresh.
Note: SiteWatch data is historical data and does not need to be refreshed.
Sign Out
The dashboard header provides a user icon, which when selected, provides a Sign Out function to sign out of Insights 2.0.
Select a Site
The dashboard provides a site selector to open a list of all sites within the organization, and then select a site to view its data in the dashboards.

Selecting the site selector (it's set to All Sites by default), opens a list with all sites. Users can navigate up and down the list to select a site. In addition, the site list includes the following features: site search, select all sites, deselect all sites, and multi-site selection.
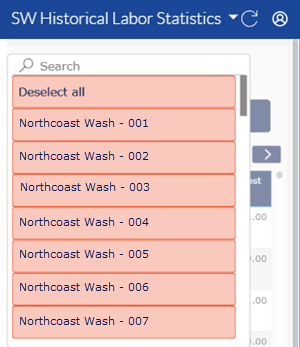
- Search: A search tool is available at the top of the site list for multi-site organizations that have a large number of sites. It can be used to quickly locate a site without navigating through the entire list. Note: The search function is case-sensitive.
- Select all / Deselect all: All sites can be selected or deselected.
- Multi-Site Select: Multiple, select sites can be selected. Select a site to include it; select it again to not include it.
Select a Time Period
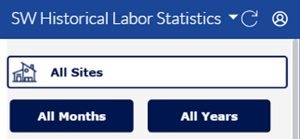
A month(s) and year(s) time period selector is provided to choose the month(s) and year(s) to view the dashboard for. By default, the month time period is set to All Months and the year time period is set to All Years.
All Months
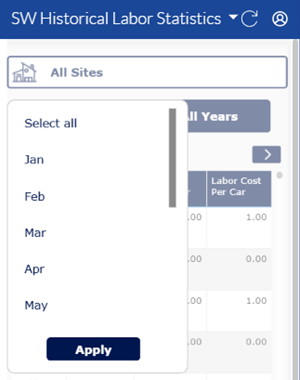
The month selector is set to All Months when the dashboard is opened. Select it to open the month selector and choose a specific month, select all months, or select multiple specific months. The month selector.includes a Select all / Deselect all toggle function and each calendar month. A selected month has a red background; a deselected month has a white background. An Apply function is provided to confirm any selection and open the dashboard for the selected month(s).
Note: Use the month selector in conjunction with the year selector (below) to view specific month and year data.
All Years
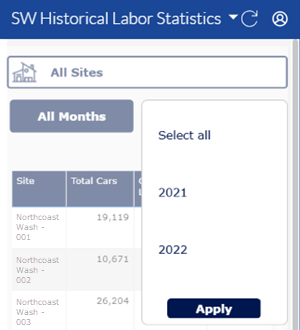
The year selector is set to All Years when the dashboard is opened. Select it to open the year selector and choose a specific year, all years, or select multiple specific years. The year selector.includes a Select all / Deselect all toggle function and each year of data that is available (in YYYY format). A selected year has a red background; a deselected year has a white background. An Apply function is provided to confirm any selection and open the dashboard for the selected year(s).
Note: Use the year selector in conjunction with the month selector (above) to view specific month and year data.
Labor Statistics Table
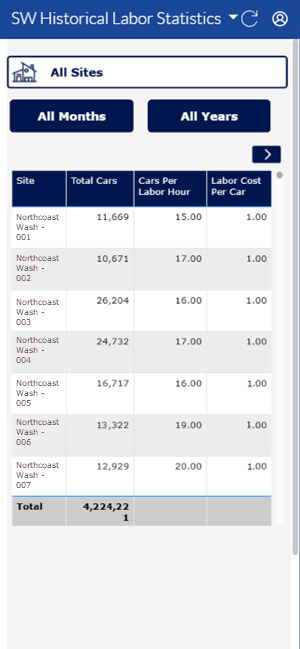
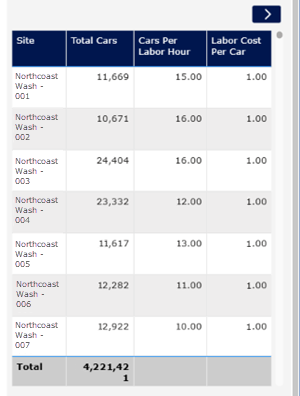
The SW Historical Labor Statistics dashboard consists of one table. It provides the following historical SiteWatch labor statistics: total car count, cars per labor hour, labor cost per car, labor percentage, sales per car, and sales per labor hour, for the selected site and time period.
Site
The Site column provides the name of each site within the organization.
The column can be sorted in ascending or descending alphanumerical order by selecting its header.
Total Cars
The Total Cars column provides the total number of cars that received a wash for the selected site and time period.
The column can be sorted in ascending or descending numerical order by selecting its header.
Cars Per Labor Hour
The Cars Per Labor Hour column provides the average number of cars washed per labor hour. It is the total car count divided by the total labor hour count.
The column can be sorted in ascending or descending numerical order by selecting its header.
Labor Cost Per Car
The Labor Cost Per Car column provides the average labor cost per washed car. It is the total labor dollars divided by total car count.
The column can be sorted in ascending or descending numerical order by selecting its header.
Labor %
The Labor % column provides the total labor divided by the total sales, then multiplied by 100.
The column can be sorted in ascending or descending numerical order by selecting its header.

Sales Per Car
The Sales Per Car column provides the average dollar amount for each car. It is the total wash revenue divided by total car count.
The column can be sorted in ascending or descending numerical order by selecting its header.
Sales Per Labor Hour
The Sales Per Labor Hour column provides the total sales revenue divided by the total labor hours.
The column can be sorted in ascending or descending numerical order by selecting its header.