Deprecated Insights 1.0 Dashboard Metrics in Insights 2.0
This topic lists all Insights 1.0 dashboards that have been replaced by Insights 2.0. dashboards. While these dashboards are no longer available, each metric in them is available in Insights 2.0. Use the information below to see where each deprecated dashboard's metrics can be viewed in Insights 2.0. The following Insights 1.0 dashboards have been deprecated.
- Current Statistics
- Multi-Site Statistics
- Sales Comparison
- Plan Analysis (Deprecated May 28, 2025)
- Plan Churn (Deprecated May 28, 2025)
- Plan Reloads (Deprecated May 28, 2025)
- Plan Usage (Deprecated May 28, 2025)
Important: This topic will be updated as each Insights 1.0 dashboard is deprecated. See Patheon Insights 1.0 to Insights 2.0 Transition for information on the transition from Insights 1.0 to Insights 2.0.
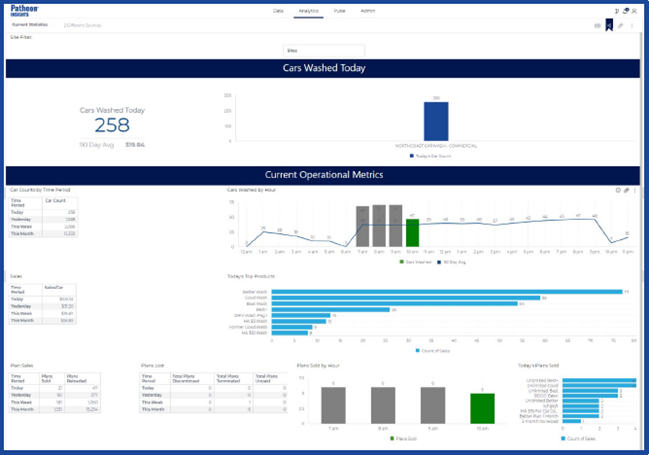
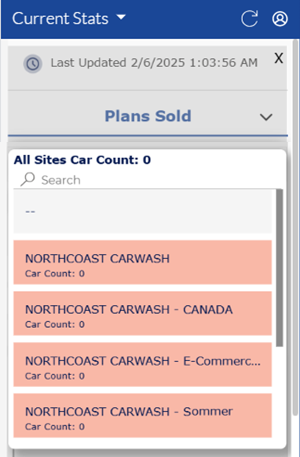
Current Statistics
The following table identifies each of the deprecated Insights 1.0 Current Statistics dashboard's metrics, and where to access each metric in Insights 2.0. Most of these metrics are available in the Insights 2.0 Current Stats dashboard; however, some are available in the Multi-Site Stats dashboard. Use the link in each Insights 2.0 path to view more information about that Insights 2.0 dashboard and corresponding metric.
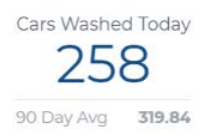
Cars Washed Today
|
Insights 1.0 Metric |
Insights 2.0 Metric |
|
Cars Washed Today
|
Insights 2.0>Operational Efficiency>Current Stats>Todays Car Counts>Cars Washed
|
|
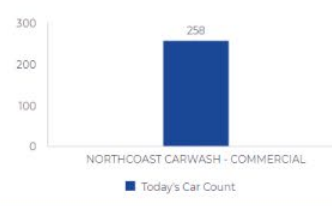
Today's Car Count
*For multi-site organizations, all sites are listed here. |
Insights 2.0>Operational Efficiency>Current Stats><Select a Site>
*For multi-site organizations, all site car counts are listed here. |

Current Operational Metrics
|
Insights 1.0 Metric |
Insights 2.0 Metric |
|
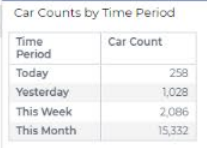
Car Counts by Time Period
|
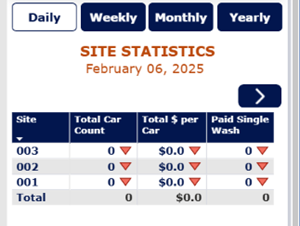
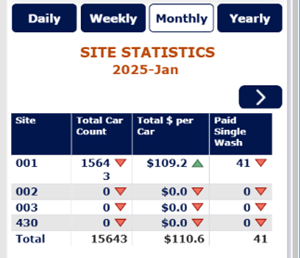
Insights 2.0>Operational Efficiency>Multi-Site Stats>Site Statistics>Total Car Count
*View for all sites, select specific sites, or a single site, as well as day, week, month, or year. |
|
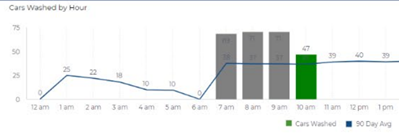
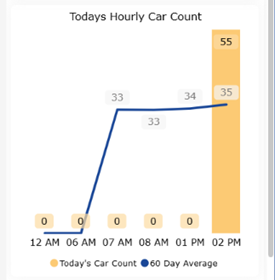
Cars Washed by Hour
|
Insights 2.0>Operational Efficiency>Current Stats>Todays Car Counts>Todays Hourly Car Count
|
|
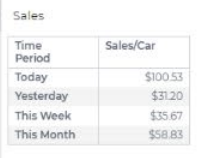
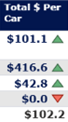
Sales/Car
*This is sales revenue per vehicle. |
Insights 2.0>Operational Efficiency>Multi-Site Stats>Site Statistics>Total $ per Car
*This is sales revenue per vehicle. **View for all sites, select specific sites, or a single site, as well as day, week, month, or year. |
|
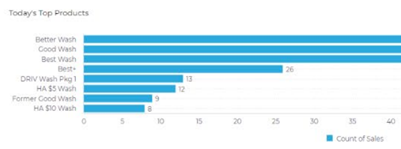
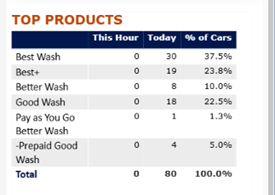
Today's Top Products
|
Insights 2.0>Operational Efficiency>Current Stats>Sales>Top Products
*Provides count of each sold wash and % of total sold washes. |
|
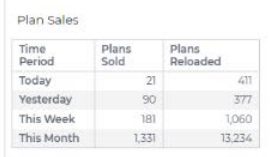
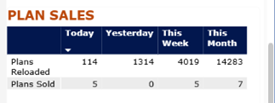
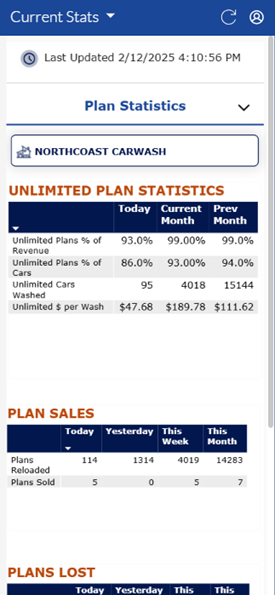
Plan Sales
|
Insights 2.0>Operational Efficiency>Current Stats>Plan Statistics>Plan Sales
|
|
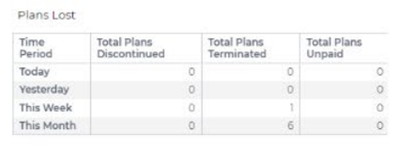
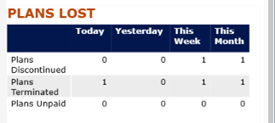
Plans Lost
|
Insights 2.0>Operational Efficiency>Current Stats>Plan Statistics>Plans Lost
|
|
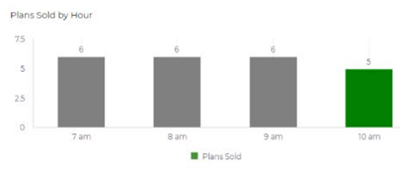
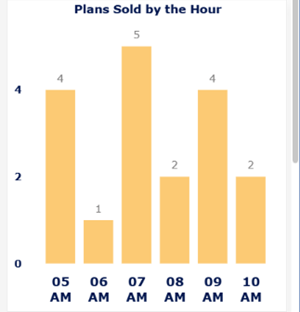
Plans Sold by Hour
|
Insights 2.0>Operational Efficiency>Current Stats>Plans Sold>Plans Sold by the Hour
|
|
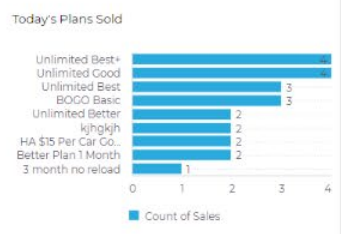
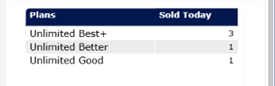
Today's Plans Sold
|
Insights 2.0>Operational Efficiency>Current Stats>Plans Sold>Sold Today
|
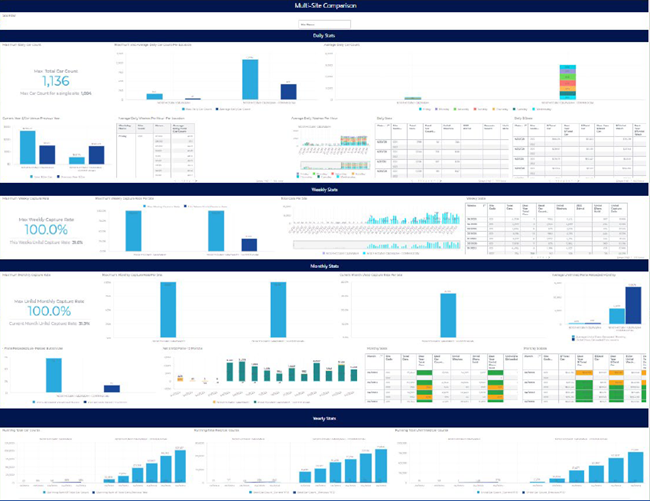
Multi-Site Statistics
The following table identifies each of the deprecated Insights 1.0 Multi-Site Statistics dashboard's metrics, and where to access that metric in Insights 2.0. Use the link in each Insights 2.0 path to view more information about that Insights 2.0 dashboard and corresponding metric.
Daily Stats
|
Insights 1.0 Metric |
Insights 2.0 Metric |
|
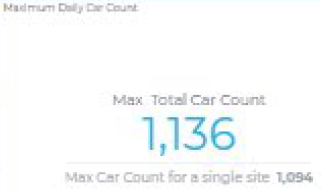
Maximum Daily Car Count
|
Insights 2.0>Operational Efficiency>Sales Comparison>Daily Stats
|
|
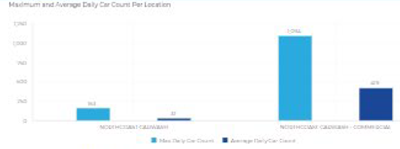
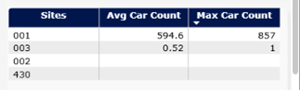
Maximum and Average Daily Car Count Per Location
|
Insights 2.0>Operational Efficiency>Sales Comparison>Daily Stats
|
|
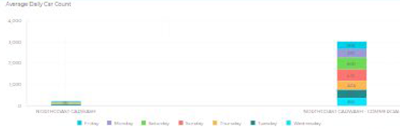
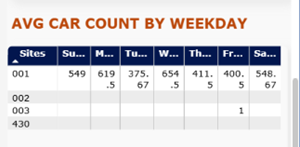
Average Daily Car Count
|
Insights 2.0>Operational Efficiency>Sales Comparison>Daily Stats>Avg Car Count by Weekday
|
|
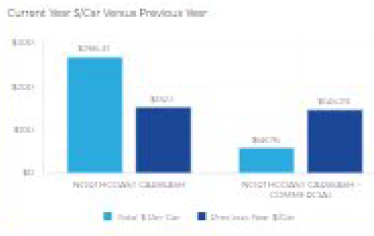
Current Year $/Car Versus Previous Year
|
Insights 2.0>Operational Efficiency>Sales Comparison>Sales Comparison>Year
|
|
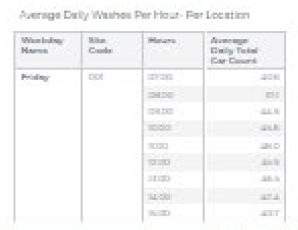
Average Daily Washes Per Hour- Per Location
|
Insights 2.0>Operational Efficiency>Sales Comparison>Site Comparison>Average Daily Washes per Hour by Weekday
*View and compare for all sites, select specific sites, or a single site, by any day of the week. |
|
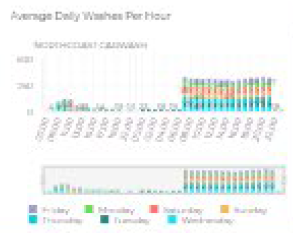
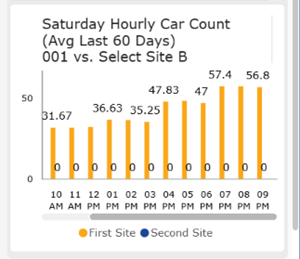
Average Daily Washes Per Hour
|
Insights 2.0>Operational Efficiency>Sales Comparison>Site Comparison><Weekday> Hourly Car Count
*Select all sites to view the 60-day hourly averages for an entire organization, an individual site to view its 60-day hourly averages, or compare all to a specific site to view the specific site's effect on an organization's average hourly car count. |
|
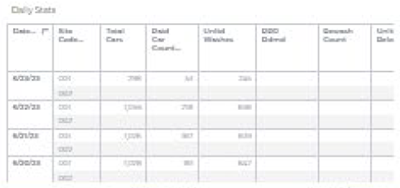
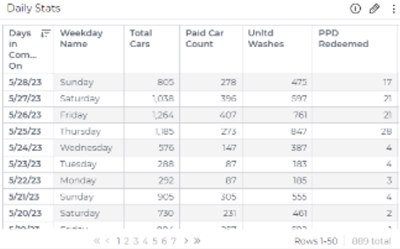
Daily Stats
|
Insights 2.0>Operational Efficiency>Multi-Site Stats>Site Statistics
|
|
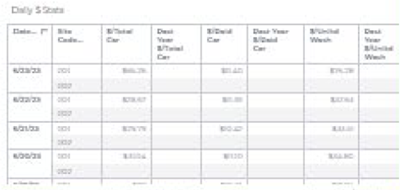
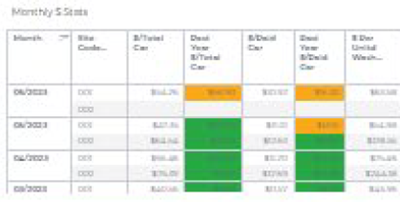
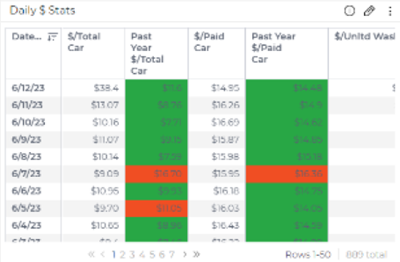
Daily $ Stats
|
Insights 2.0>Operational Efficiency>Multi-Site Stats>Site Statistics
|
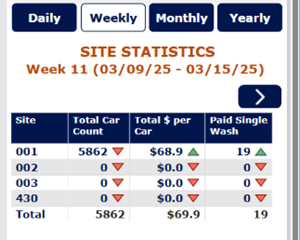
Weekly Stats
|
Insights 1.0 Metric |
Insights 2.0 Metric |
|
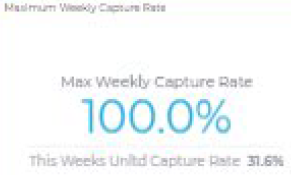
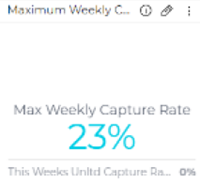
Maximum Weekly Capture Rate
|
Insights 2.0>Operational Efficiency>Multi-Site Stats>>Weekly>Site Statistics>Unltd Capture Rate
|
|
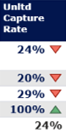
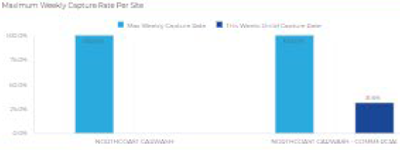
Maximum Weekly Capture Rate Per Site
|
Insights 2.0>Operational Efficiency>Multi-Site Stats>Weekly>Site Statistics>Unltd Capture Rate
A tile is also available, but only in Patheon Portal.
|
|
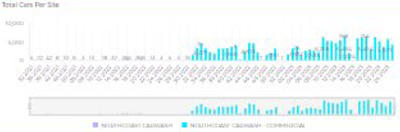
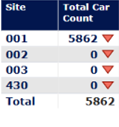
Total Cars Per Site
|
Insights 2.0>Operational Efficiency>Multi-Site Stats>Weekly>Site Statistics>Total Car Count
*Total car count by site can also be viewed by day, month, or year. |
|
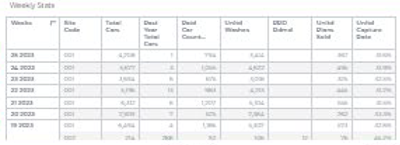
Weekly Stats
|
Insights 2.0>Operational Efficiency>Multi-Site Stats>Weekly>Site Statistics
*These stats can also be viewed by day, month, or year. |

Monthly Stats
|
Insights 1.0 Metric |
Insights 2.0 Metric |
|
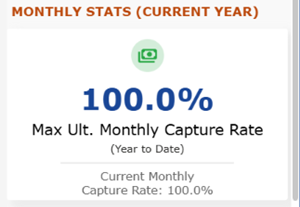
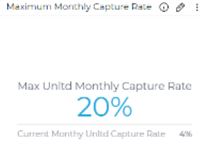
Maximum Monthly Capture Rate
|
Insights 2.0>Operational Efficiency>Sales Comparison>Monthly Stats>Monthly Stats (Current Year)
|
|
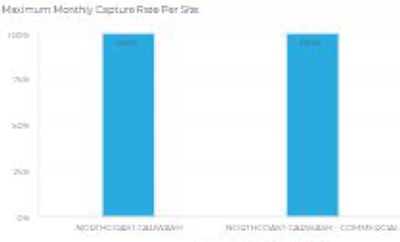
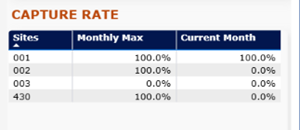
Maximum Monthly Capture Rate Per Site
|
Insights 2.0>Operational Efficiency>Sales Comparison>Monthly Stats>Capture Rate
|
|
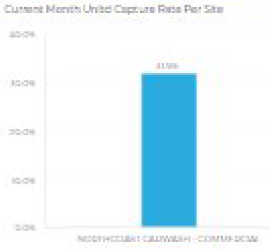
Current Month Unltd Capture Rate Per Site
|
Insights 2.0>Operational Efficiency>Sales Comparison>Monthly Stats>Capture Rate
|
|
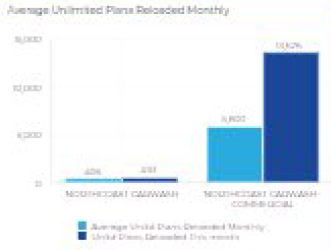
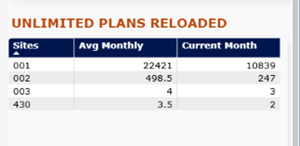
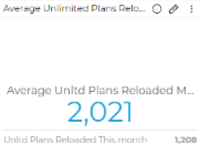
Avg Unlimited Plans Reloaded Monthly
|
Insights 2.0>Operational Efficiency>Sales Comparison>Monthly Stats>Unlimited Plans Reloaded
|
|
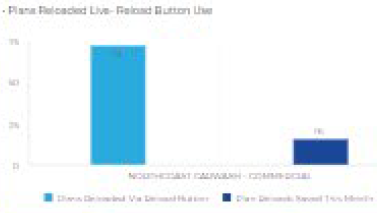
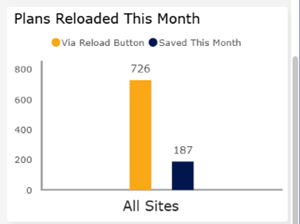
Plans Reloaded Live - Reload Button Use
|
Insights 2.0>Operational Efficiency>Sales Comparison>Monthly Stats>Plans Reloaded This Month
|
|
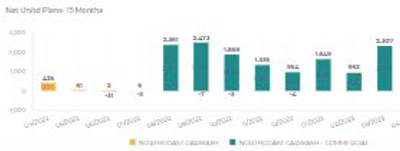
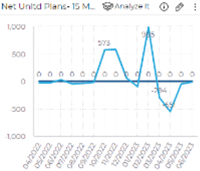
Net Unltd Plans - 15 Months
|
Insights 2.0>Operational Efficiency>Sales Comparison>Running Totals>Unlimited Car Counts
|
|
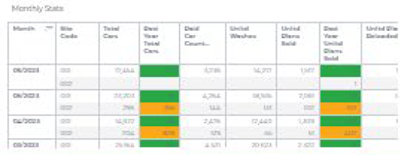
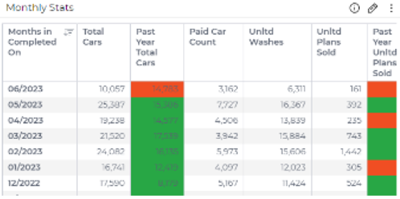
Monthly Stats
|
Insights 2.0>Operational Efficiency>Multi-Site Stats>Monthly>Site Statistics
|
|
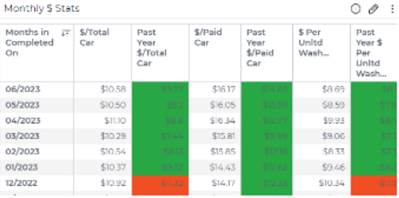
Monthly $ Stats
|
Insights 2.0>Operational Efficiency>Multi-Site Stats>Monthly>Site Statistics
|

Yearly Stats
|
Insights 1.0 Metric |
Insights 2.0 Metric |
|
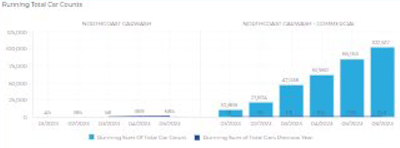
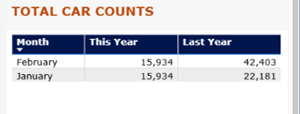
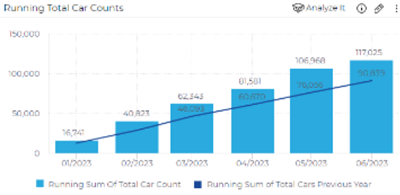
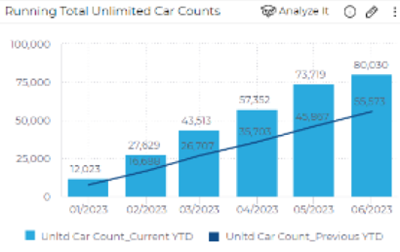
Running Total Car Counts
|
Insights 2.0>Operational Efficiency>Sales Comparison>Running Totals>Total Car Counts
|
|
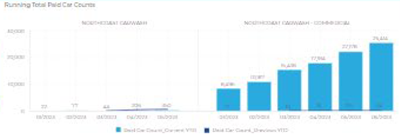
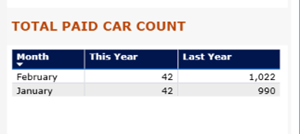
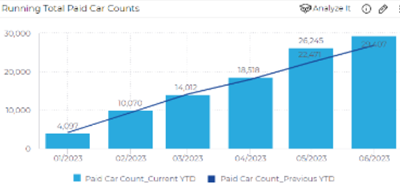
Running Total Paid Car Counts
|
Insights 2.0>Operational Efficiency>Sales Comparison>Running Totals>Total Paid Car Count
|
|
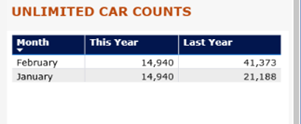
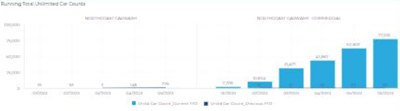
Running Total Unlimited Car Counts
|
Insights 2.0>Operational Efficiency>Sales Comparison>Running Totals>Unlimited Car Counts
|
Sales Comparison
The following table identifies each of the deprecated Insights 1.0 Sales Comparison dashboard's metrics, and where to access that metric in Insights 2.0. Use the link in each Insights 2.0 path to view more information about that Insights 2.0 dashboard and corresponding metric.

Daily Stats
|
Insights 1.0 Metric |
Insights 2.0 Metric |
|
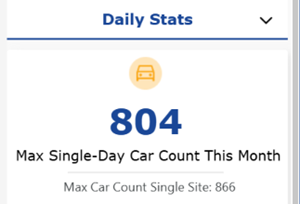
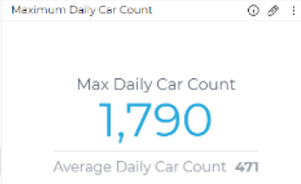
Maximum Daily Car Count
|
Insights 2.0>Operational Efficiency>Sales Comparison>Daily Stats>Max Single-Day Car Count This Month
*The max car count is also available from an hourly perspective. |
|
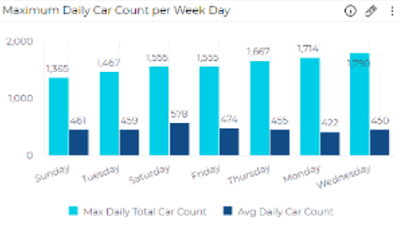
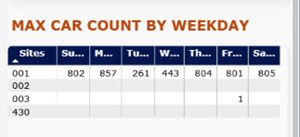
Maximum Daily Car Count per Week Day
|
Insights 2.0>Operational Efficiency>Sales Comparison>Daily Stats>Max Car Count by Weekday
|
|
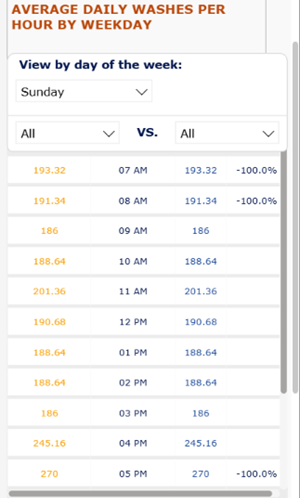
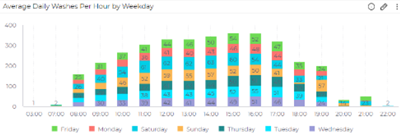
Average Daily Washes Per Hour by Weekday
|
Insights 2.0>Operational Efficiency>Sales Comparison>Site Comparison>Average Daily Washes per Hour by Weekday
*Select all sites to view the 60-day hourly averages for an entire organization, an individual site to view its 60-day hourly averages, or compare all to a specific site to view the specific site's effect on an organization's average hourly car count. |
|
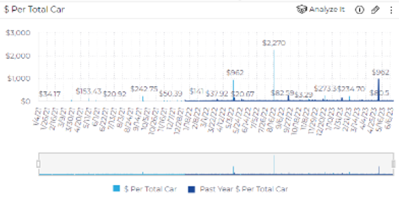
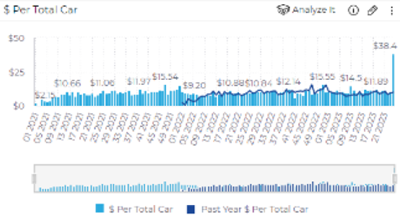
$ Per Total Car
|
Insights 2.0>Operational Efficiency>Multi-Site Stats>Daily>Site Statistics
*Use the Sales Comparison>Sales Comparison dashboard to compare total $ per car from the current time period to a previous time period. |
|
Daily Stats
|
Insights 2.0>Operational Efficiency>Multi-Site Stats>Daily>Site Statistics
|
|
Daily $ Stats
|
Insights 2.0>Operational Efficiency>Multi-Site Stats>Daily>Site Statistics
|
Weekly Stats
|
Insights 1.0 Metric |
Insights 2.0 Metric |
|
Maximum Weekly Capture Rate
|
Insights 2.0>Operational Efficiency>Sales Comparison>Monthly Stats>Monthly Stats (Current Year)
|
|
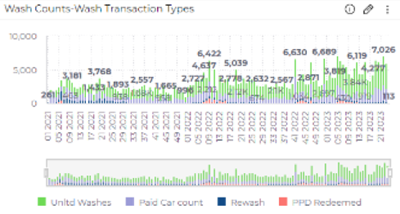
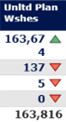
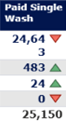
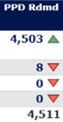
Wash Counts-Wash Transaction Types
|
Insights 2.0>Operational Efficiency>Multi-Site Stats>Weekly>Site Statistics>Unltd Plan Wshes
Insights 2.0>Operational Efficiency>Multi-Site Stats>Weekly>Site Statistics>Paid Single Wash
Insights 2.0>Operational Efficiency>Multi-Site Stats>Weekly>Site Statistics>PPD Rdmd
Insights 2.0>Operational Efficiency>Multi-Site Stats>Weekly>Site Statistics>Rewash Count
|
|
$ Per Total Car
|
Insights 2.0>Operational Efficiency>Sales Comparison>Sales Comparison>Week
|
|
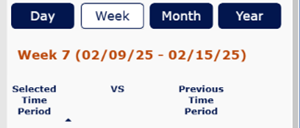
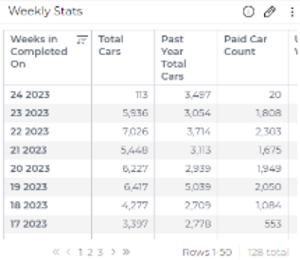
Weekly Stats
|
Insights 2.0>Operational Efficiency>Sales Comparison>Sales Comparison>Week
|
Monthly Stats
|
Insights 1.0 Metric |
Insights 2.0 Metric |
|
Maximum Monthly Capture Rate
|
Insights 2.0>Operational Efficiency>Sales Comparison>Monthly Stats>Monthly Stats (Current Year)
|
|
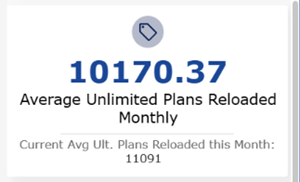
Average Unlimited Plans Reload
|
Insights 2.0>Operational Efficiency>Sales Comparison>Monthly Stats>Average Unlimited Plans Reloaded Monthly
|
|
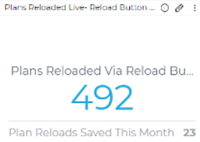
Plans Reloaded Live- Reload Button
|
Insights 2.0>Operational Efficiency>Sales Comparison>Monthly Stats>Plans Reloaded This Month
|
|
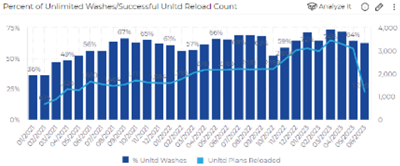
Percent of Unlimited Washes/Successful Unltd Reload Count
|
Insights 2.0>Operational Efficiency>Current Stats>Plan Statistics
*Count of unlimited plan washes is also available in the Multi-Site Stats dashboard. |
|
Net Unltd Plans- 15 Months
|
Insights 2.0>Operational Efficiency>Sales Comparison>Running Totals>Unlimited Car Counts
|
|
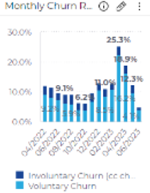
Monthly Churn Rate
|
N/A. See the Insights 1.0 Plan Churn dashboard for this metric. |
|
Monthly Stats
|
Insights 2.0>Operational Efficiency>Sales Comparison>Sales Comparison>Month
*These stats can also be viewed by day, week, and year. |
|
Monthly $ Stats
|
Insights 2.0>Operational Efficiency>Sales Comparison>Sales Comparison>Month
*These stats can also be viewed by day, week, and year. |
Yearly Stats
|
Insights 1.0 Metric |
Insights 2.0 Metric |
|
Running Total Car Counts
|
Insights 2.0>Operational Efficiency>Sales Comparison>Running Totals>Total Car Counts
|
|
Running Total Paid Car Counts
|
Insights 2.0>Operational Efficiency>Sales Comparison>Running Totals>Total Paid Car Count
|
|
Running Total Unlimited Car Counts
|
Insights 2.0>Operational Efficiency>Sales Comparison>Running Totals>Unlimited Car Counts
|
Plan Analysis
The following table identifies each of the deprecated Insights 1.0 Plan Analysis dashboard's metrics, and where to access each metric in Insights 2.0. Most of these metrics are available in the Insights 2.0 Plan Analysis dashboard.
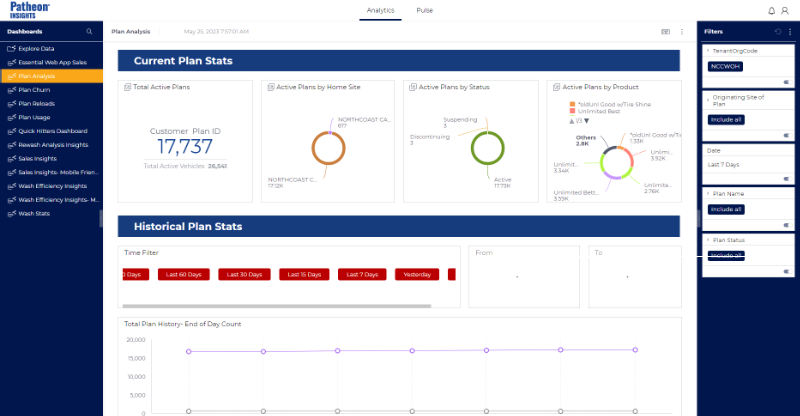
Current Plan Stats
|
Insights 1.0 Metric |
Insights 2.0 Metric |
|
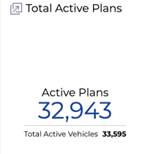
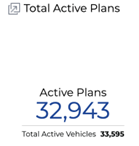
Total Active Plans
|
Insights 2.0>Plan Analytics>Plan Analysis>Current Plan Stats>CURRENT PLAN STATISTICS>Active Plans
|
|
Total Active Plan Vehicles
|
Insights 2.0>Plan Analytics>Plan Analysis>Current Plan Stats>>CURRENT PLAN STATISTICS>Active Plan Vehicle Count
|
|
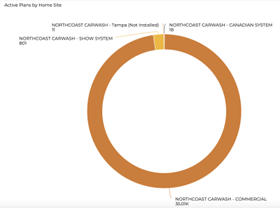
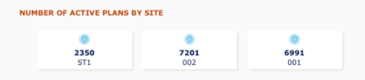
Active Plans by Home Site
|
Insights 2.0>Plan Analytics>Plan Analysis>Current Plan Stats>NUMBER OF ACTIVE PLANS BY SITE
|
|
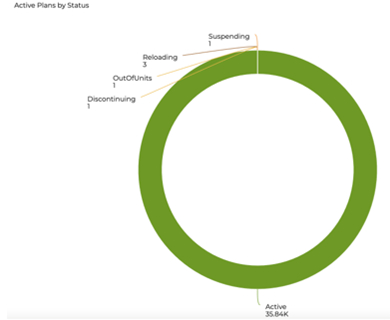
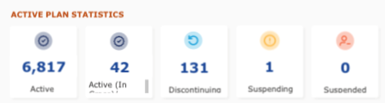
Active Plans by Status
|
Insights 2.0>Plan Analytics>Plan Analysis>Current Plan Stats>ACTIVE PLAN STATISTICS
|


Historical Plan Stats
|
Insights 1.0 Metric |
Insights 2.0 Metric |
|
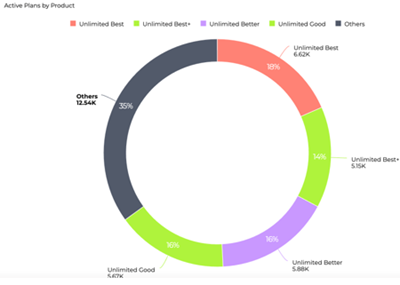
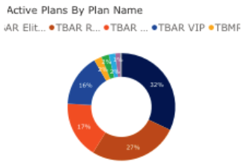
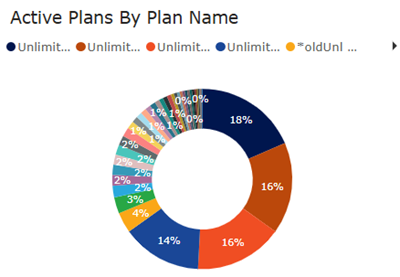
Active Plans by Product
|
Insights 2.0>Plan Analytics>Plan Analysis>Current Plan Stats>ACTIVE PLAN STATISTICS>Active Plans By Plan Name
|
|
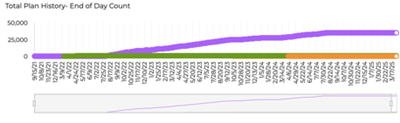
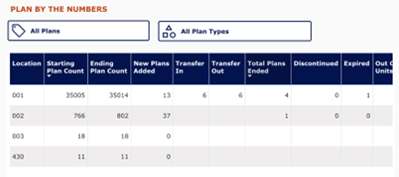
Total Plan History - End of day count
|
Insights 2.0>Plan Analytics>Plan Analysis>Plan Stats>PLAN BY THE NUMBERS>
|
|
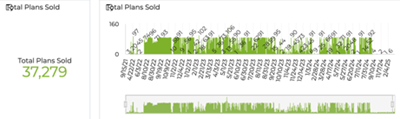
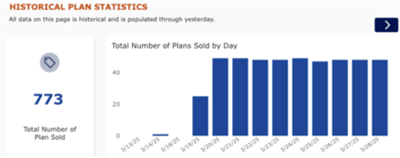
Plans Sold
|
Insights 2.0>Plan Analytics>Plan Analysis>Historical Stats>HISTORICAL PLAN STATISTICS
|
|
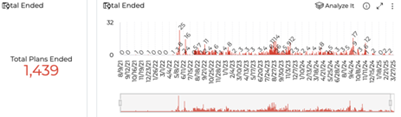
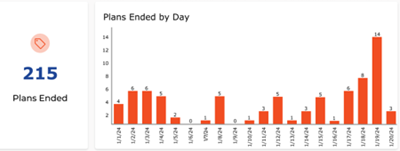
Plans Ended
|
Insights 2.0>Plan Analytics>Plan Analysis>Historical Stats>HISTORICAL PLAN STATISTICS
|
|
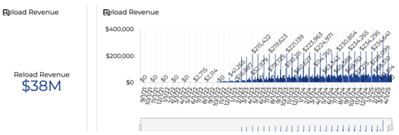
Reload Revenue
|
Insights 2.0>Plan Analytics>Plan Analysis>Historical Stats>HISTORICAL PLAN STATISTICS
|
Plan Churn
The following table identifies each of the deprecated Insights 1.0 Plan Churn dashboard's metrics, and where to access each metric in Insights 2.0. Most of these metrics are available in the Insights 2.0 Plan Churn dashboard.
|
Insights 1.0 Metric |
Insights 2.0 Metric |
|
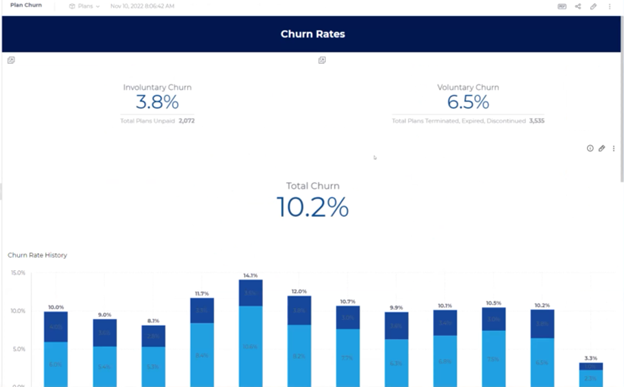
Involuntary Churn
|
Insights 2.0>Plan Analytics>Plan Churn>Churn Statistics>Involuntary Churn Percentage
|
|
Voluntary Churn
|
Insights 2.0>Plan Analytics>Plan Churn>Churn Statistics>Voluntary Churn Percentage
|
|
Total Churn
|
Insights 2.0>Plan Analytics>Plan Churn>Churn Statistics>Churn Percentage
|
|
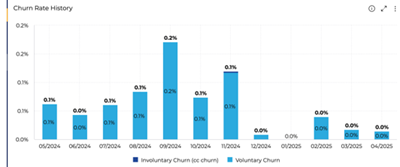
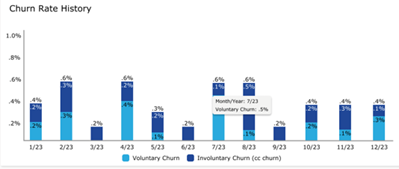
Churn Rate History
|
Insights 2.0>Plan Analytics>Plan Churn>Historical Statistics>Churn Rate History
|
|
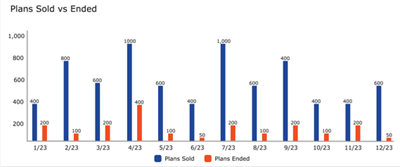
Plans Sold vs Plans Ended
|
Insights 2.0>Plan Analytics>Plan Churn>Historical Statistics>Plans Sold vs Plans Ended
|
|
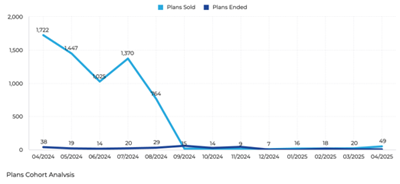
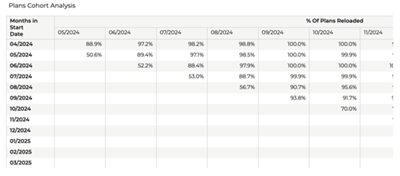
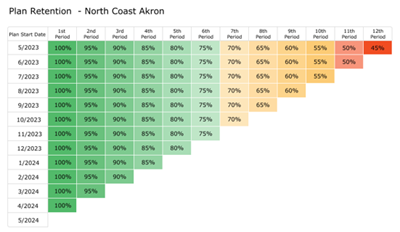
Plans Cohort Analysis
|
Insights 2.0>Plan Analytics>Plan Churn>Historical Statistics>Plan Retention
|

Plan Reloads
The following table identifies each of the deprecated Insights 1.0 Plan Reloads dashboard's metrics, and where to access each metric in Insights 2.0. Most of these metrics are available in the Insights 2.0 Plan Reloads dashboard.
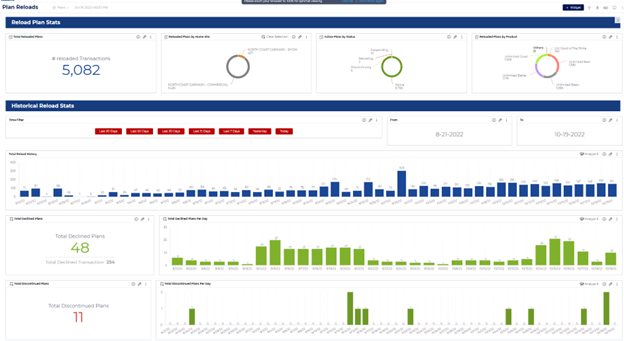
Reload Plan Stats
|
Insights 1.0 Metric |
Insights 2.0 Metric |
|
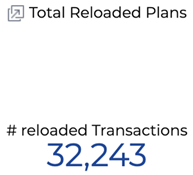
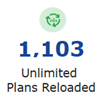
Total Reloaded Plans
|
Insights 2.0>Plan Analytics>Plan Reloads>Reload Overview>PLANS RELOADED>Unlimited Plans Reloaded
|
|
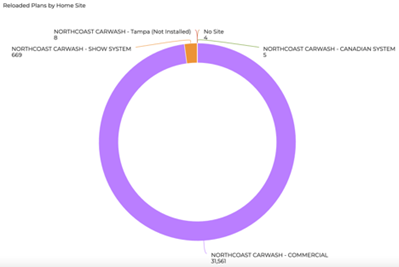
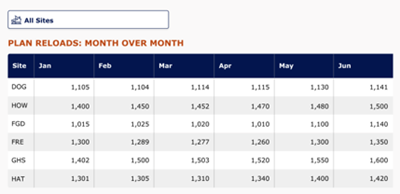
Reloaded Plans By Home Site
|
Insights 2.0>Plan Analytics>Plan Reloads>Reloads Month Over Month>PLAN RELOADS: MONTH OVER MONTH
|
|
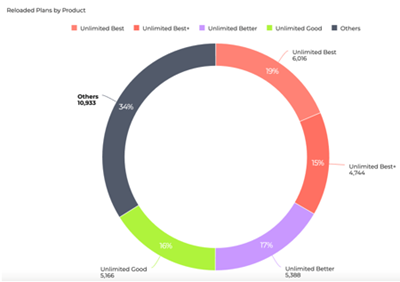
Reloaded Plans By Product
|
Insights 2.0>Plan Analytics>Plan Reloads>Current Plan Stats>ACTIVE PLAN STATISTICS>Active Plans By Plan Name
|
|
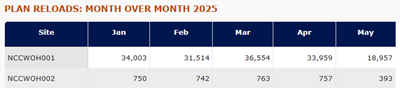
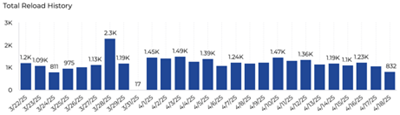
Total Reload History
|
Insights 2.0>Plan Analytics>Plan Reloads>Month Over Month>PLAN RELOADS: MONTH OVER MONTH
|
Historical Reload Stats
|
Insights 1.0 Metric |
Insights 2.0 Metric |
|
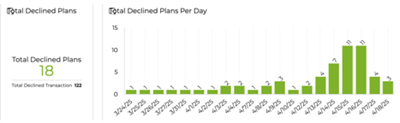
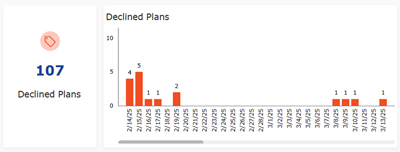
Total Declined Plans by Day
|
Insights 2.0>Plan Analytics>Plan Reloads>History>PLAN RELOAD HISTORY>Declined Plans
|
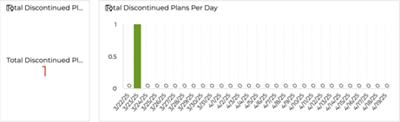
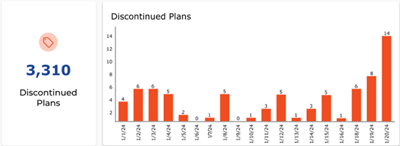
|
Total Discontinued Plans
|
Insights 2.0>Plan Analytics>Plan Reloads>History>PLAN RELOAD HISTORY>Discontinued Plans
|
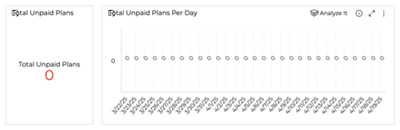
|
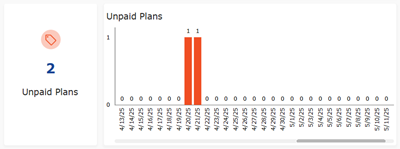
Total Unpaid Plans
|
Insights 2.0>Plan Analytics>Plan Reloads>History>PLAN RELOAD HISTORY>Unpaid Plans
|
|
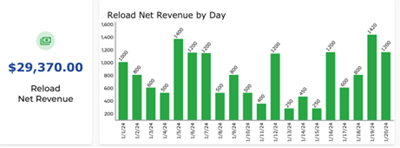
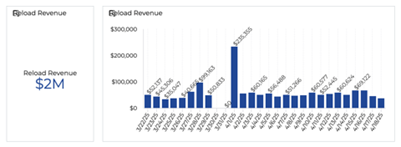
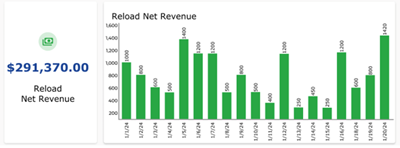
Reload Revenue
|
Insights 2.0>Plan Analytics>Plan Reloads>History>PLAN RELOAD HISTORY>Reload Net Revenue
|
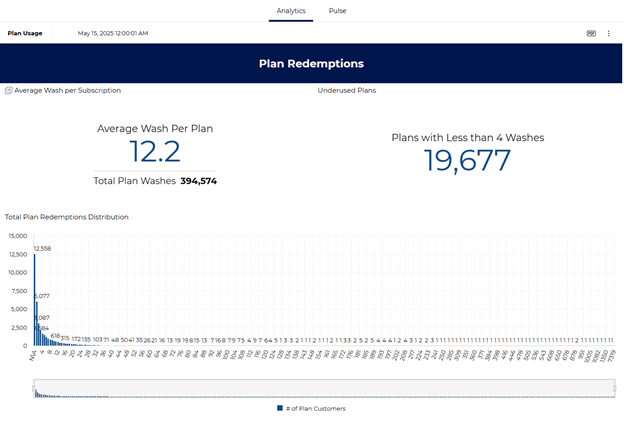
Plan Usage
The following table identifies each of the deprecated Insights 1.0 Plan Usage dashboard's metrics, and where to access each metric in Insights 2.0. Most of these metrics are available in the Insights 2.0 Plan Usage dashboard.
|
Insights 1.0 Metric |
Insights 2.0 Metric |
|
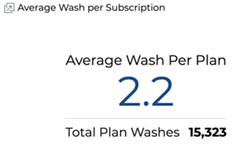
Average Wash Per Plan
|
Insights 2.0>Plan Analytics>Plan Usage>Plan Redemption>PLAN REDEMPTION>Avg Washes Per Plan
|
|
Total Plan Washes
|
Insights 2.0>Plan Analytics>Plan Usage>Plan Redemption>PLAN REDEMPTION>Plan Redemptions
|
|
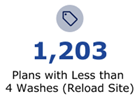
Plans with Less than 4 Washes
|
Insights 2.0>Plan Analytics>Plan Usage>Plan Wash Stats>PLAN WASH STATS>Plans with Less than 4 Washes (Reload Site)
|
|
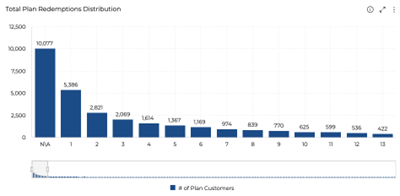
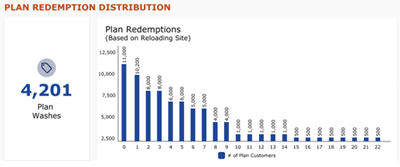
Total Plan Redemptions Distribution
|
Insights 2.0>Plan Analytics>Plan Usage>Plan Usage>PLAN REDEMPTION DISTRIBUTION
|
|
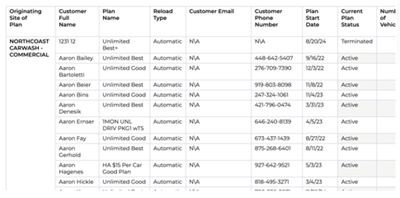
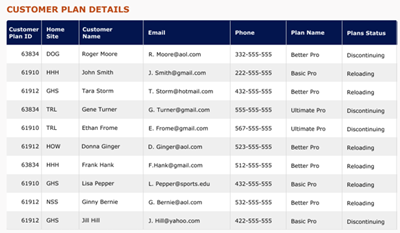
Customer Plan Details
|
Insights 2.0>Plan Analytics>Plan Usage>Customer Details>CUSTOMER PLAN DETAILS
|
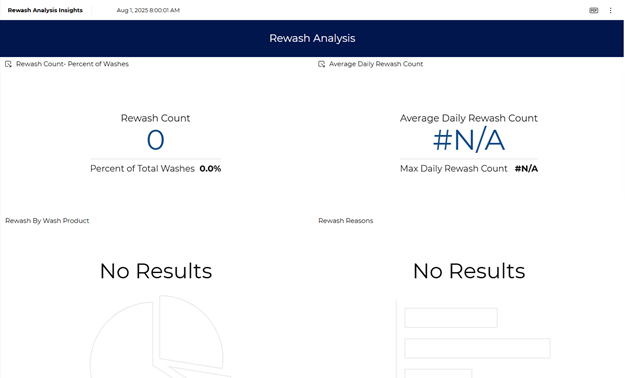
Rewash Analysis Insights
The following table identifies each of the deprecated Insights 1.0 Rewash Analysis Insights dashboard's metrics, and where to access each metric in Insights 2.0. Most of these metrics are available in the Insights 2.0 Rewash Analysis dashboard.
|
Insights 1.0 Metric |
Insights 2.0 Metric |
|
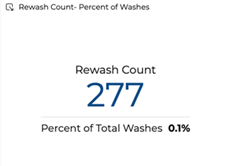
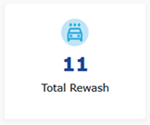
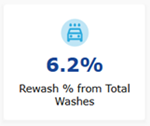
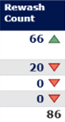
Rewash Count and Percent of Total Washes
|
Insights 2.0>Financial Outlook>Rewash Analysis>Total Rewash
Insights 2.0>Financial Outlook>Rewash Analysis>Rewash % from Total Washes
|
|
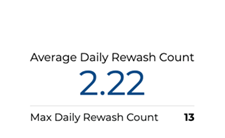
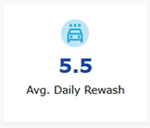
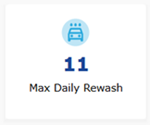
Average Daily Rewash Count and Max Daily Rewash Count
|
Insights 2.0>Financial Outlook>Rewash Analysis>Active Plans by Home Site
Insights 2.0>Financial Outlook>Rewash Analysis>Max Daily Rewash
|
|
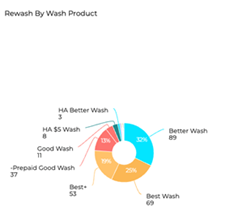
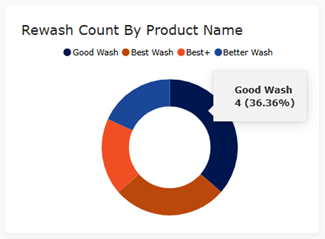
Rewash By Wash Product
|
Insights 2.0>Financial Outlook>Rewash Analysis>Rewash Count By Product Name
|
|
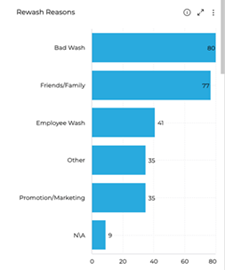
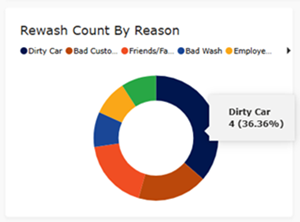
Rewash Reasons
|
Insights 2.0>Financial Outlook>Rewash Analysis>Rewash Count By Reason
|
|
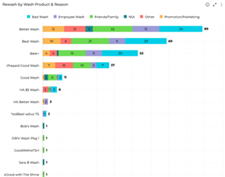
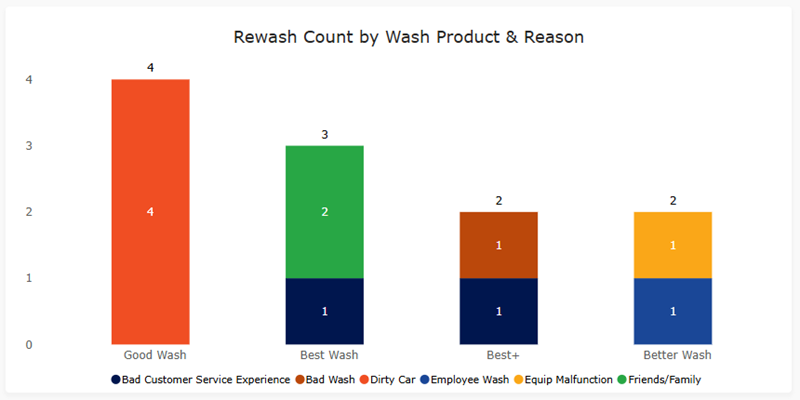
Rewash by Wash Product & Reason
|
Insights 2.0>Financial Outlook>Rewash Analysis>Rewash Count by Wash Product & Reason
|